Hello everyone!
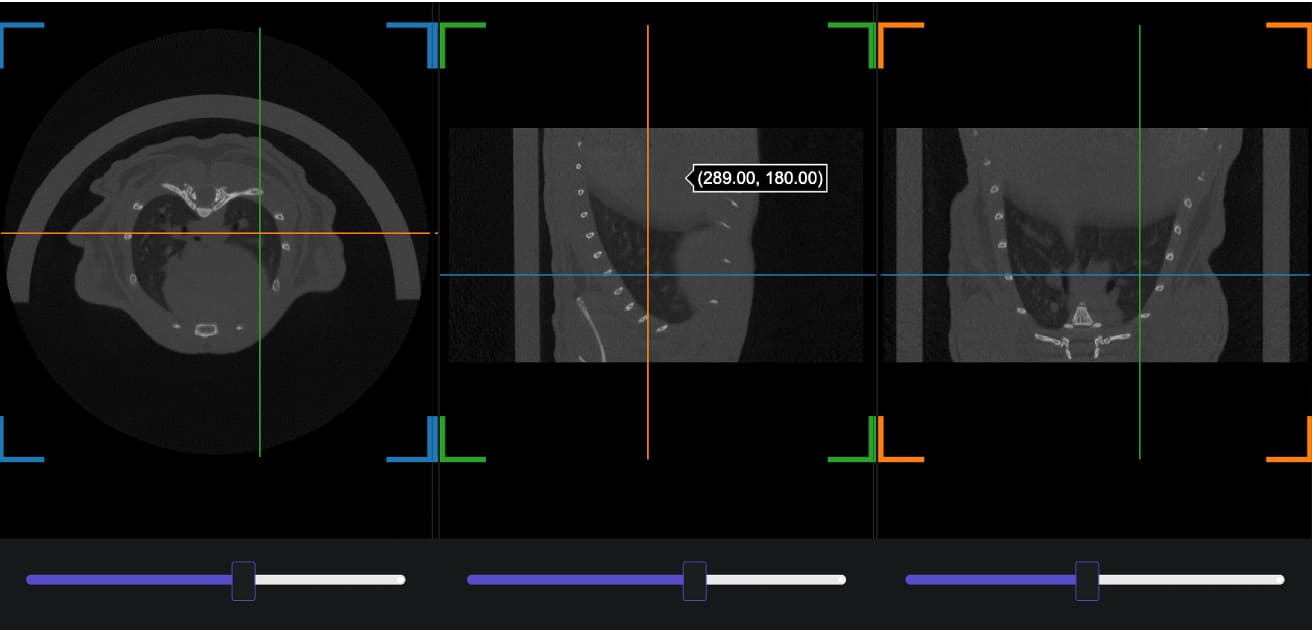
I have been trying to implement extendData to update the values of the y axis of a 3dMesh using a slider. The main purpose of using extendData to update the y axis is to move the dark blue/gray squared marker (see screenshot below) across the lung mesh (the green mesh in the screenshot).

I have tried following the documentation and multiple examples I have found but nothing works for my graph. Can someone help me find out if I am missing something or doing something wrong? The following is my script. The data to run the script is here Box
Thank you so much for your help ![]()
import numpy as np

# DASH
import dash
from dash import Dash, dcc, html, Input, Output, State
import dash_bootstrap_components as dbc
from dash_slicer import VolumeSlicer
from jupyter_dash import JupyterDash
JupyterDash.infer_jupyter_proxy_config()

# GRAPHS
import plotly.graph_objects as go
from plotly.subplots import make_subplots

# LOAD DATA
fx = np.loadtxt("fx.txt")
fy = np.loadtxt("fy.txt")
fz = np.loadtxt("fz.txt")
fi = np.loadtxt("fi.txt")
fj = np.loadtxt("fj.txt")
fk = np.loadtxt("fk.txt")


makersOpacity = 0.18
markerColor = "#244063"
# DISPLAY LUNG MESH
fig_mesh = make_subplots(rows= 1, cols=1, specs=[[{"type": "scene"}]])
fig_mesh.add_trace(go.Mesh3d(x=fz, y=fy, z=fx, opacity=1, i=fk, j=fj, k=fi, color='#0be02f', name= "Fixed Image", showlegend=False, flatshading = False), row=1, col=1)

fig_mesh.add_trace(go.Mesh3d(
        # 8 vertices of a rectangle
        x=[130, 130, 360, 360, 130, 130, 360, 360],
        y=[250, 251, 251, 250, 250, 251, 251, 250], # CORONAL MARKER
        z=[150, 150, 150, 150, 400, 400, 400, 400],

        i = [7, 0, 0, 0, 4, 4, 6, 6, 4, 0, 3, 2],
        j = [3, 4, 1, 2, 5, 6, 5, 2, 0, 1, 6, 3],
        k = [0, 7, 2, 3, 6, 7, 1, 1, 5, 5, 7, 6],
        opacity=makersOpacity,
        color= markerColor,
        name = "Coronal Marker",
        showlegend=False,
        flatshading = False
    ), row=1, col=1)

### SETTING CAMERA ANGLE FOR VIEW ###
camera_settings = dict(
    up=dict(x=1, y=0, z=1),
    center=dict(x=0, y=0, z=0),
    eye=dict(x=-1.2, y=-1.5, z=0.8)
)

### LAYOUT FOR SCENCE OR 3D ANIMATION ###
fig_mesh.update_layout(scene_camera= camera_settings,
                       scene=dict(
        xaxis=dict(showticklabels=False, visible=False),
        yaxis=dict(showticklabels=False, visible=False),
        zaxis=dict(showticklabels=False, visible=False)),
                       width=800, height=600, paper_bgcolor='rgba(0,0,0,0.5)')

# DASH
app = JupyterDash(__name__, external_stylesheets=[dbc.themes.BOOTSTRAP, dbc.icons.FONT_AWESOME])

app.layout = html.Div(children=[
    dcc.Graph(
        id='lungMesh',
        figure=fig_mesh
    ),
    html.Div(
        [
            dcc.Slider(
                id='coronalSlider',
                min=160.,
                max=360,
                step=1,
                value=0,
                marks=None,
                updatemode='drag',
            ),
        ],
        style=dict(width='50%'),
    ),
])

@app.callback(
    Output('lungMesh', 'extendData'),
    Input('coronalSlider', 'value'),
    prevent_initial_call=True)

def update_data(corVal):
    coronalMarker=[corVal,corVal+1, corVal+1, corVal, corVal, corVal+1, corVal+1, corVal]
    return dict(y=[coronalMarker]), [1]

app.run_server(mode ="external", debug=True)