I am using Plotly and some Ipywidgets such as VBox, HBox, Button in order to visualize a network. I use widgets to do some filtering on the network (e.g. when you search a keyword, it shows its neighborhood graph).
Is there any way that I can export my graph and all widgets (filters and onClick actions) as an HTML file? what about other formats?
Hi @naser,
It’s possible to export a notebook including widgets to html using nbconvert (https://github.com/jupyter/nbconvert). You need to make sure to save the notebook using the classic Jupyter Notebook (not JupyterLab) with the “Widgets -> Save Notebook Widget State” menu option.
Unfortunately, it’s not possible to preserve the behavior of the callback functions this way because these functions are defined using Python, and there’s no Python kernel available in the standalone HTML file.
To host interactive figures outside of the notebook I’d recommend writing a Dash app (https://dash.plot.ly/). If you want to stay in notebook/widget world you could try https://github.com/QuantStack/voila, but I don’t have any personal experience with that yet.
-Jon
Hi,
Thanks a lot for the response. The problem is that its a relatively long time that I am working on this script for and I don’t think it would be easy to transfer it to dash.
I will try Viola then.
Thanks
Great, if you do try out Viola please let us know how it goes!
Hi,
I tried using your method. However, I have slightly different project structure. I have written the plotly and ipywidget codes in a separate module and I am calling the functions from this custom module in the jupyter notebook to create the widgets and the plots.
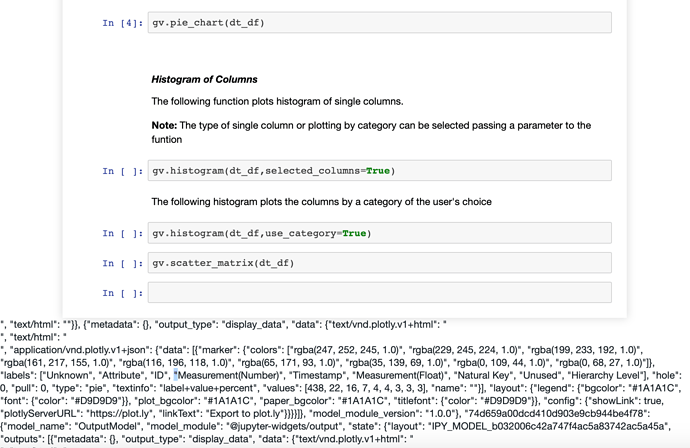
When I try to export the created plots to html from the jupyter notebook gui, the plot was not rendering. However, when I tried your method, I got the html file with a .json printed right the bottom of the page.
What am I missing ? Would appreciate any help. Thanks.
I am attaching two screenshots to show the notebook output and the html output.
Hi @soham9230,
The JSON dump at the bottom suggests that something in the notebook is calling plotly.offline.iplot which doesn’t sound like what you want if you’re intending to use FigureWidgets to display the figures.
Does a simple example of exporting a FigureWidget by itself using nbconvert work for you? Feel free to post a small reproducible example.
-Jon
Thanks a lot for the response @jmmease . I am not familiar with FigureWidget. Let me try it out and I’ll keep you updated.
Thanks,
Soham
Hi @jmmease,
So I tried using FigureWidget. Below is the custom function to display a box plot of all the numeric columns -
def boxplot(dataframe):
    columns = __collectNumberColumns(dataframe)
    #columns =list(dataframe.columns)
    @interact
    def plot_box(boxpoints=['False','outliers','suspectedoutliers','all'],boxmean=['None','Mean','Standard Deviation']):
        if boxpoints == 'False':
            boxpoints = False
        if boxmean == 'None':
            boxmean = False
        elif boxmean == 'Mean':
            boxmean = True
        elif boxmean == 'Standard Deviation':
            boxmean = 'sd'

        data = []
        for column in columns:
            trace0 = go.Box(y=list(dataframe[column]),
            name = column,
            boxmean=boxmean,
            boxpoints=boxpoints)
            data.append(trace0)

        #data = list(trace)
        fig = go.FigureWidget(data=data)
        iplot(fig)
Now , this function is in a different module (.py file). I am calling this function in a jupyter notebook which creates the visualization as shown in the picture. But while exporting ( the process you shared ) , the plot is not showing.
If the plotting code is in the jupyter cell, then the plot is being rendered in the html.
Note : I am facing this issue only when @interact and widgets are involved. If I am writing a column specific code without any widget , I am getting the plot rendered.
Again, appreciate any help.
Regards,
Soham
Hi @soham9230,
But while exporting ( the process you shared ) , the plot is not showing. If the plotting code is in the jupyter cell, then the plot is being rendered in the html.
Based on your cf_go_offline() method, I’m assuming you’re using cufflinks underneath. So one caveat here is that I’m not familiar with what cufflinks is doing inside to display the plotly figures.
In any case, could you check the browser JavaScript console after opening the exported HTML documents? There might be some clues here ![]()
-Jon
Hi @jmmease,
I am attaching the screenshot of the JavaScript console. It does have some errors. I am researching the issues , meanwhile it would be great if you can suggest something based on the issues.
Regards,
Soham
Hi @soham9230, Nothing jumps out at me from the error message. Can you reproduce the error without a FigureWidget? i.e. with only the built-in ipywidget buttons/sliders etc. If so, then a good next step might be to raise the issue with the nbconvert folks at https://github.com/jupyter/nbconvert.
-Jon
I tried Voila, but then it needs the kernel to be switched on to keep the ipywidgets filter active, and the html immediately lost the interactive function when I transfer it to someone else. any other method to export the html while keeping the ipywidget alive?
Well, this problem has been puzzling me for some time, till I found a very “not so smart” solution for it.
I go to the widgets menu in the notebook and choose Embed Widgets, which gives me the html code for the box I have created.


