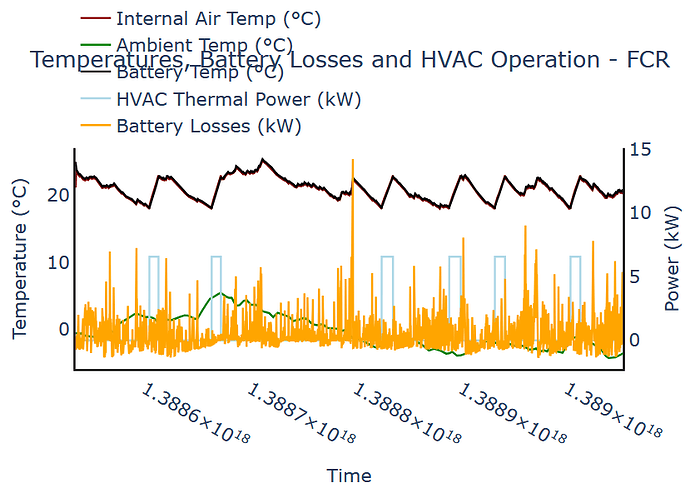
Hey @AIMPED, here’s a reproducible example. I’m using Windows OS.
import numpy as np
import plotly.graph_objects as go
import plotly.io as pio

date_range = pd.date_range(start='2014-01-01', end='2014-01-07', freq='h')

np.random.seed(42)
internal_air_temp = 20 + 2 * np.sin(np.linspace(0, 3 * np.pi, len(date_range)))
ambient_temp = 10 + 3 * np.cos(np.linspace(0, 3 * np.pi, len(date_range)))
battery_temp = 25 + np.random.normal(0, 0.5, len(date_range))
hvac_power = np.abs(np.random.normal(2, 0.5, len(date_range)))  # in kW
battery_losses = np.abs(np.random.normal(0.5, 0.1, len(date_range)))  # in kW

fig = go.Figure()

fig.add_trace(go.Scatter(
    x=date_range,
    y=internal_air_temp,
    name='Internal Air Temp (°C)',
    line=dict(color='maroon'),
    yaxis='y1'
))

fig.add_trace(go.Scatter(
    x=date_range,
    y=ambient_temp,
    name='Ambient Temp (°C)',
    line=dict(color='green'),
    yaxis='y1'
))

fig.add_trace(go.Scatter(
    x=date_range,
    y=battery_temp,
    name='Battery Temp (°C)',
    line=dict(color='black'),
    yaxis='y1'
))

fig.add_trace(go.Scatter(
    x=date_range,
    y=hvac_power,
    name='HVAC Thermal Power (kW)',
    line=dict(color='lightblue'),
    yaxis='y2'
))

fig.add_trace(go.Scatter(
    x=date_range,
    y=battery_losses,
    name='Battery Losses (kW)',
    line=dict(color='orange'),
    yaxis='y2'
))

fig.update_layout(
    title=dict(text='Temperatures, Battery Losses and HVAC Operation - Example', font=dict(size=22)),
    font=dict(size=18),
    width=1400,
    height=400,
    xaxis=dict(
        title=dict(text='Time', font=dict(size=18)),
        tickfont=dict(size=18),
        showline=True,
        linecolor='black',
        linewidth=2
    ),
    yaxis=dict(
        title=dict(text='Temperature (°C)', font=dict(size=18)),
        tickfont=dict(size=18),
        side='left',
        showline=True,
        linecolor='black',
        linewidth=2,
        showgrid=False
    ),
    yaxis2=dict(
        title=dict(text='Power (kW)', font=dict(size=18)),
        tickfont=dict(size=18),
        overlaying='y',
        side='right',
        showline=True,
        linecolor='black',
        linewidth=2,
        showgrid=False
    ),
    legend=dict(
        font=dict(size=18),
        orientation='h',
        yanchor='bottom',
        y=1.02,
        xanchor='left',
        x=0
    ),
    plot_bgcolor='white',
    paper_bgcolor='white'
)

fig.show()
fig.write_image('plot.pdf', engine="kaleido")


