Hi Plotly community.
I want to share what we in the data and analytics department of CCP Games, have been working on.
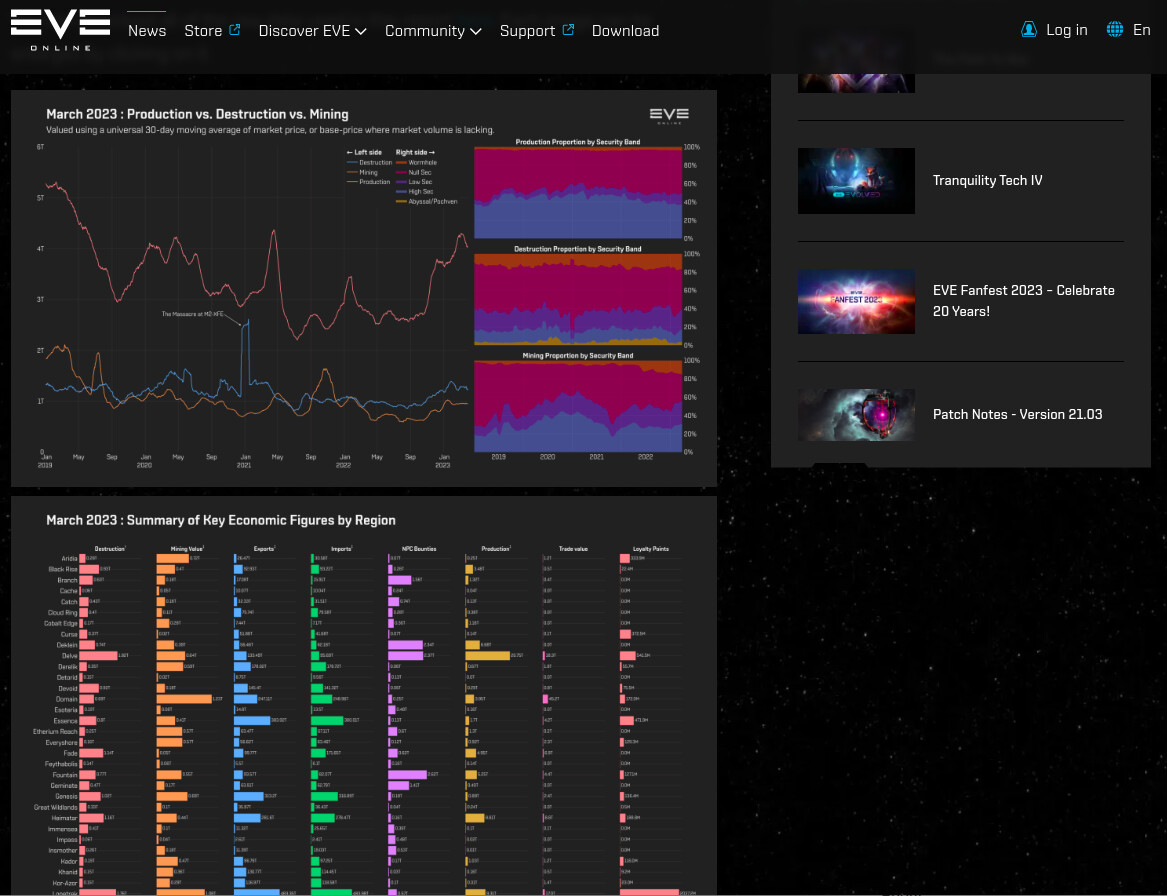
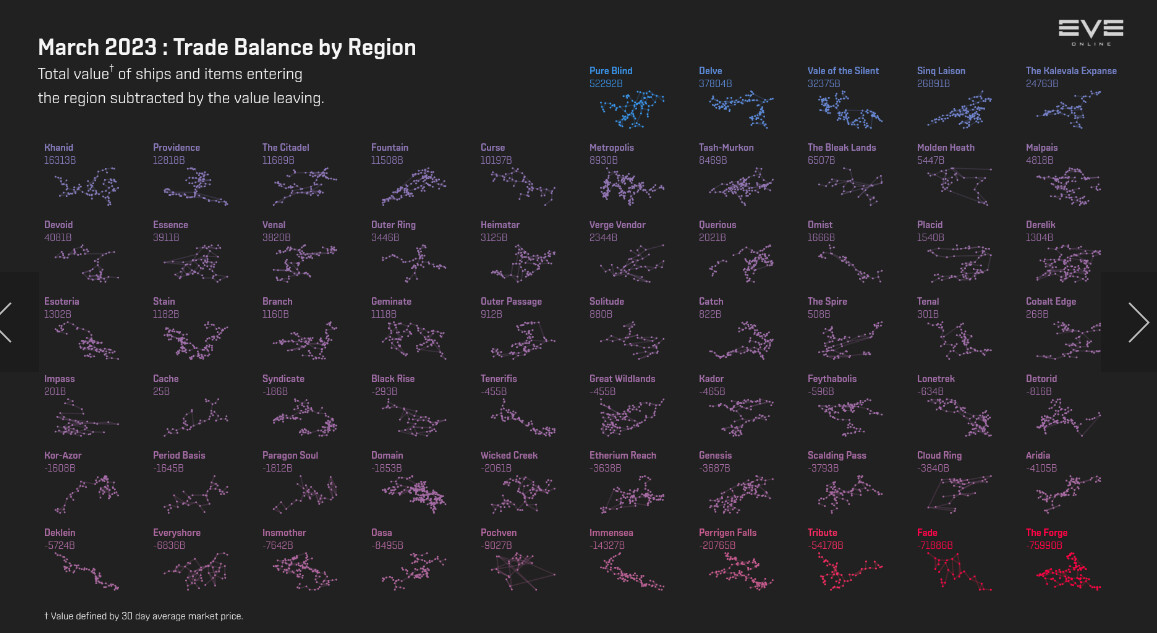
Since 2016, we have published an economic report at the beginning of every month, which is composed of multiple individual plots. The main idea behind this report is to provide the players with a glimpse into the complicated economy of EVE Online, and spark discussions on the health of the economy. The report was originally written in R, using ggplot2 to create all of the plots, but over the years the analytics department became more reliant on Python for analytics work.
Thus, in 2020 we started experimenting with transforming the report from R into Python. For that we had to find a library that could replace ggplot2, which ended up being Plotly. That transformation was fully completed in February last year, and here are the results of that transformation:
- March 2023 report: https://www.eveonline.com/news/view/monthly-economic-report-march-2023
- June 2018 report, written in R ggplot2 for comparison: https://www.eveonline.com/news/view/monthly-economic-report-june-2018
The zip data attached with the report, includes both dark mode and light mode for every plot, as well as html version for most of the graphs. In total the report is composed 118 png and html files.