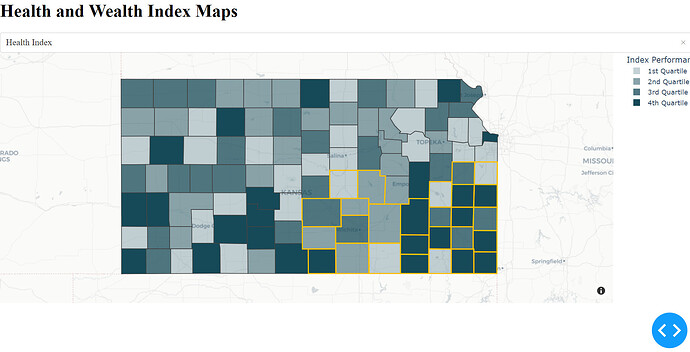
import dash
from dash import dcc
from dash import html
import plotly.graph_objects as go
from healthindex import health_fig
from wealthindex import wealth_fig

# Create the Dash application
app = dash.Dash(__name__)

# Define your Dash layout
app.layout = html.Div(
    children=[
        html.H1("Health and Wealth Index Maps"),
        dcc.Dropdown(
            id='index-dropdown',
            options=[
                {'label': 'Health Index', 'value': 'health'},
                {'label': 'Wealth Index', 'value': 'wealth'}
            ],
            value='health'  # Default value
        ),
        dcc.Graph(id='index-graph')
    ]
)

# Define the callback function to update the graph based on the dropdown selection
@app.callback(
    dash.dependencies.Output('index-graph', 'figure'),
    [dash.dependencies.Input('index-dropdown', 'value')]
)
def update_graph(index):
    # Update the graph based on the dropdown selection
    if index == 'health':
        return health_fig
    elif index == 'wealth':
        return wealth_fig
    else:
        # Handle other cases
        return go.Figure()

if __name__ == '__main__':
    app.run_server(debug=True)
every time I run this app, it works nicely
if I run the app in my quartopage using
<iframe src="http://000.0.0.0:8050" width=700 height=600>
it says loading the whole time it’s very slow
