Editable Datatable

Hi everyone !

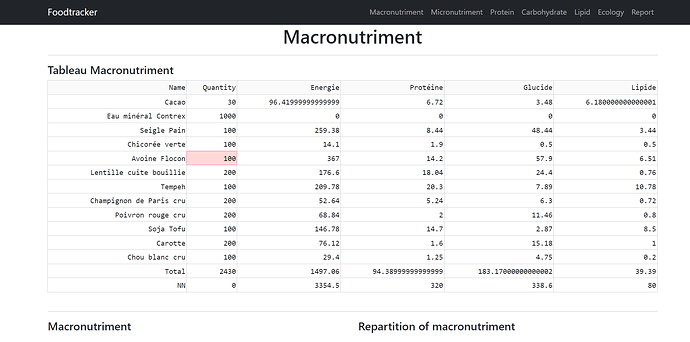
I’m coding my first dash app since month, I love it! And now I’m facing the following challenge : I have a menu with for example banana quantity calorie protein carbohydrate lipid.
And i would like to change quantity directly in the datatable and then the amount of protein and nutriments will change also.

This is the first objective, the second I don’t know if it’s straightforward once we solved the first problem. Or if it’s difficult on his own. Anyway, it would be to update as well the graphic once one change the quantity.


In order to be general and help other I provide a minimal example find on stackoverflow. And we can imagine that Number of Solar Plants is quantity. So when we change Number of Solar Plants so the Installed Capacity change for example like this (just for the sake of example) :
Installed Capacity = 18*Installed Capacity change

import dash
import dash_table
import pandas as pd

df = pd.read_csv(“https://raw.githubusercontent.com/plotly/datasets/master/solar.csv”)

app = dash.Dash(name)

app.layout = dash_table.DataTable(
id=“table”,
columns=[{“name”: i, “id”: i} for i in df.columns],
data=df.to_dict(“records”),
editable=True,
)

If dash able of that ? Or should I switch to another library ?

Hi @Plotlyoko,

You can refer to the examples in the datatable interactivity section of the documentation. Sorting, Filtering, Selecting, and Paging Natively | Dash for Python Documentation | Plotly
Editable DataTable | Dash for Python Documentation | Plotly

I’m sure that with the editable option on the column and access the data of the active row you can figure something out that performs some form of recalculation :slight_smile:

As of recent there is also, a dash ag grid opensource component. I haven’t used it, but supposedly it’s a more feature rich version of a table component.

Regards,
J.

1 Like

HI @Plotlyoko

To see an example of an editable table that also updates other columns, you can see an example here:

1 Like

Hi @ AnnMarieW! Thank you for your help! It took me some trials to adapt it but I have something now.
I added a new buttons to launch the app which will contains the graphics, the datatable, … And I can go back to modify the datatable (the menu) so it’s great.

Here’s my code now. I post it to help other people and, as a beginner, to have some advice to improve it.

import dash
from dash import Dash, dcc, html, dash_table, Output, Input
import dash_bootstrap_components as dbc
import pandas as pd

product_data = {
    "product": ['Apple',"Banana","Chicken Breast", "Dunk leg","Egg"]
}
new_order_line = {"product": "","Transformation":"","Transformation Intensity":"", "quantity": 0, "Meal": 1}

df_product = pd.DataFrame(product_data)
df_new_order_line = pd.DataFrame(new_order_line, index=[0])
table = dash_table.DataTable(
    id="table",
    columns=[
        {
            "name": "Product",
            "id": "product",
            "editable": True,
            "presentation": "dropdown",
        },
        {
            "name": "Transformation",
            "id": "transformation",
            "editable": True,
            "presentation": "dropdown",
        },
        {
            "name": "Transformation Intensity",
            "id": "transformation intensity",
            "editable": True,
            "presentation": "dropdown",
        },
        {
            "name": "Quantity",
            "id": "quantity",
            "type": "numeric",
            "format": {"specifier": ",.0f"},
            "editable": True,
            "on_change": {"failure": "default"},
            "validation": {"default": 0},
        },
        {
            "name": "Meal",
            "id": "meal",
            "editable": True,
            "presentation": "dropdown",
        },
    ],
    data=df_new_order_line.to_dict("records"),
    row_deletable=True,
    dropdown={
        "product": {
            "options": [{"label": i, "value": i} for i in df_product["product"]]
        },
        "transformation": {
            "options": [{"label": i, "value": i} for i in ["Row","Roasted","Boiled","Frozen", "Dried"]]
        },
        "transformation intensity": {
            "options": [{"label": i, "value": i} for i in ["Low","Medium","High"]]
        },
        "meal": {
            "options": [{"label": i, "value": i} for i in [1,2,3,4,5,6,7,8]]
        },
    },
)

app = Dash(__name__)

title = html.H4("Order Entry Table", style={"textAlign": "center", "margin": 30})
add_button = dbc.Button(children = "+", n_clicks=0, id="add-btn")
submit_button = dbc.Button(id="submit", n_clicks=0, children="Submit", className="ms-2")
app.layout = html.Div([title, 
                       add_button, 
                       table, 
                       submit_button,
                        html.Br(),
                        html.Div(id='my-output', children = []),
            ], style={"margin": 30})

@app.callback(
    Output("table", "data"),
    Input("add-btn", "n_clicks"),
    Input("table", "data"),
    prevent_initial_call=True,
)
def add_row(add_btn, rows):
    df_order = pd.DataFrame(rows)
    ctx = dash.callback_context
    ctrl_id = ctx.triggered[0]['prop_id'].split('.')[0]
    # add a new line
    if ctrl_id == "add-btn":
        df_order = df_order.append(df_new_order_line, ignore_index=True)
        
    return df_order.to_dict("records")

@app.callback(
    Output(component_id='my-output', component_property='children'),
    Input("submit", "n_clicks"),
    Input("table", "data"),
)
def add_app(submit_btn, rows):
    """
    """
    df_order = pd.DataFrame(rows)
    ctx = dash.callback_context
    ctrl_id = ctx.triggered[0]['prop_id'].split('.')[0]
    if ctrl_id == "submit":
        layout = dbc.Container([
        dbc.Row([
            html.Center(html.H1("Foodtracker"))
        ]),
        html.Hr(),
        dbc.Row([
                html.H4("Table"), 
                dash_table.DataTable(
                    data=df_order.to_dict('records'),
                    columns=[
                        {"name": i, "id": i} for i in df_order.columns
                    ],
                )
            ])
        ])
        return layout

app.run('localhost', 1000)
HI @Plotlyoko
THank you for sharing your solution with us. Where do you get the new_order_line from?

Would you be able to paste the full code with the library imports, so people can run this code on their computer?

Hi @adamschroeder thank you for noticing I have edited my answer

Thank you,
I added the library imports, so now people can run the code locally.

The Add button doesn’t do anything in this sample code. Is that on purpose?

The add button is meant to add a line dynimically to the datatable.

I think it doesn’t work because we forgot to add ctx in the import. I’ll edit it

This one worked for me

import dash
from dash import Dash, dcc, html, dash_table, Output, Input, State, ctx
import dash_bootstrap_components as dbc
import pandas as pd

product_data = {
    "product": ['Apple',"Banana","Chicken Breast", "Dunk leg","Egg"]
}
new_order_line = {"product": "","Transformation":"","Transformation Intensity":"", "quantity": 0, "Meal": 1}

df_product = pd.DataFrame(product_data)
df_new_order_line = pd.DataFrame(new_order_line, index=[0])
table = dash_table.DataTable(
    id="table",
    columns=[
        {
            "name": "Product",
            "id": "product",
            "editable": True,
            "presentation": "dropdown",
        },
        {
            "name": "Transformation",
            "id": "transformation",
            "editable": True,
            "presentation": "dropdown",
        },
        {
            "name": "Transformation Intensity",
            "id": "transformation intensity",
            "editable": True,
            "presentation": "dropdown",
        },
        {
            "name": "Quantity",
            "id": "quantity",
            "type": "numeric",
            "format": {"specifier": ",.0f"},
            "editable": True,
            "on_change": {"failure": "default"},
            "validation": {"default": 0},
        },
        {
            "name": "Meal",
            "id": "meal",
            "editable": True,
            "presentation": "dropdown",
        },
    ],
    data=df_new_order_line.to_dict("records"),
    row_deletable=True,
    dropdown={
        "product": {
            "options": [{"label": i, "value": i} for i in df_product["product"]]
        },
        "transformation": {
            "options": [{"label": i, "value": i} for i in ["Row","Roasted","Boiled","Frozen", "Dried"]]
        },
        "transformation intensity": {
            "options": [{"label": i, "value": i} for i in ["Low","Medium","High"]]
        },
        "meal": {
            "options": [{"label": i, "value": i} for i in [1,2,3,4,5,6,7,8]]
        },
    },
)

app = Dash(__name__)

title = html.H4("Order Entry Table", style={"textAlign": "center", "margin": 30})
add_button = dbc.Button(children = "+", n_clicks=0, id="add-btn")
submit_button = dbc.Button(id="submit", n_clicks=0, children="Submit", className="ms-2")
app.layout = html.Div([title, 
                       add_button, 
                       table, 
                       submit_button,
                        html.Br(),
                        html.Div(id='my-output', children = []),
            ], style={"margin": 30})

@app.callback(
    Output("table", "data"),
    Input("add-btn", "n_clicks"),
    Input("table", "data"),
    prevent_initial_call=True,
)
def add_row(add_btn, rows):
    df_order = pd.DataFrame(rows)
    ctx = dash.callback_context
    ctrl_id = ctx.triggered[0]['prop_id'].split('.')[0]
    # add a new line
    if ctrl_id == "add-btn":
        df_order = df_order.append(df_new_order_line, ignore_index=True)
        
    return df_order.to_dict("records")

@app.callback(
    Output(component_id='my-output', component_property='children'),
    Input("submit", "n_clicks"),
    Input("table", "data"),
)
def add_app(submit_btn, rows):
    """
    """
    df_order = pd.DataFrame(rows)
    ctx = dash.callback_context
    ctrl_id = ctx.triggered[0]['prop_id'].split('.')[0]
    if ctrl_id == "submit":
        layout = dbc.Container([
        dbc.Row([
            html.Center(html.H1("Foodtracker"))
        ]),
        html.Hr(),
        dbc.Row([
                html.H4("Table"), 
                dash_table.DataTable(
                    data=df_order.to_dict('records'),
                    columns=[
                        {"name": i, "id": i} for i in df_order.columns
                    ],
                )
            ])
        ])
        return layout

app.run('localhost', 1000)