Dynamically update stacked bar annotations based on legend click

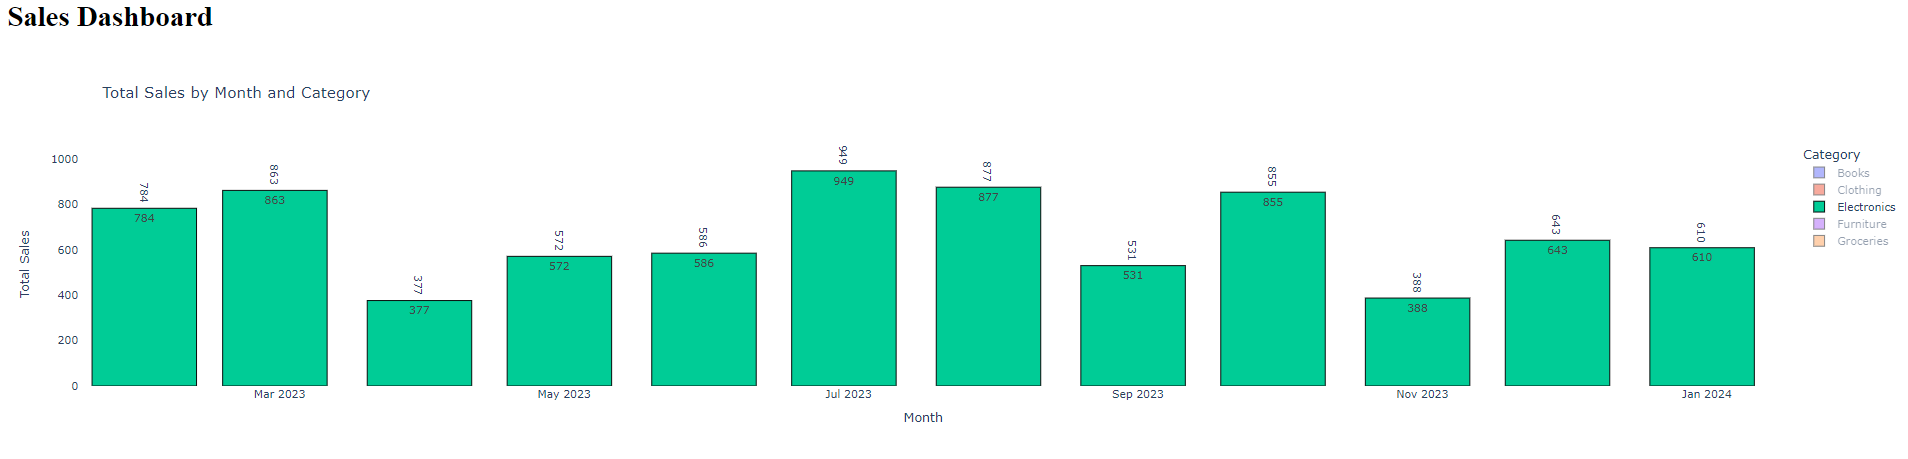
I have created a basic stacked bar graph in Python. The text inside each category contains sales for that category. Additionally, I have used annotations to specify the total of each bar.

Output graph:

Now, when I click on any legend items, the annotations stay where they are and the bar size reduces.

Is there any way to update the totals displayed in the annotation and the positioning of the same using a callback ?

import dash
from dash import dcc, html
import plotly.express as px
import pandas as pd
import numpy as np

# Define the range of months
months = pd.date_range(start='2023-01-01', end='2023-12-31', freq='M')

# Define categories
categories = ['Electronics', 'Clothing', 'Books', 'Groceries', 'Furniture']

# Generate random sales amounts
np.random.seed(0)  # For reproducibility
sales_amounts = np.random.randint(100, 1000, size=(len(months), len(categories)))

data = []
for i, month in enumerate(months):
    for j, category in enumerate(categories):
        data.append([month, category, sales_amounts[i][j]])

df = pd.DataFrame(data, columns=['Month', 'Category', 'Sale Amount'])

df_grouped = df.groupby(['Month', 'Category']).sum().reset_index()

totals = df_grouped.groupby('Month')['Sale Amount'].sum().reset_index()

fig = px.bar(df_grouped, x='Month', y='Sale Amount', color='Category',
             title='Total Sales by Month and Category',
             labels={'Sale Amount': 'Total Sales', 'Month': 'Month'},
             text='Sale Amount')

fig.update_layout(plot_bgcolor='white')
fig.update_traces(textposition = 'inside', marker=dict(line=dict(color='black', width=1)))

for i, month_total in totals.iterrows():
    fig.add_annotation(x=month_total['Month'], y=month_total['Sale Amount']+300,
                       text=f'{month_total["Sale Amount"]:.0f}', showarrow=False, textangle = 90)


app = dash.Dash(__name__)

app.layout = html.Div([
    html.H1("Sales Dashboard"),
    dcc.Graph(figure=fig, id='sales-graph')
])


if __name__ == '__main__':
    app.run_server(port=5555)

Hello @ssaishriram,

Welcome to the community!

Yes, this is possible by listening to the restyleData prop of the dcc.Graph, here is the code:

import dash
from dash import dcc, html, Input, Output, State, Patch, no_update
import plotly.express as px
import pandas as pd
import numpy as np

# Define the range of months
months = pd.date_range(start='2023-01-01', end='2023-12-31', freq='M')

# Define categories
categories = ['Electronics', 'Clothing', 'Books', 'Groceries', 'Furniture']

# Generate random sales amounts
np.random.seed(0)  # For reproducibility
sales_amounts = np.random.randint(100, 1000, size=(len(months), len(categories)))

data = []
for i, month in enumerate(months):
    for j, category in enumerate(categories):
        data.append([month, category, sales_amounts[i][j]])

df = pd.DataFrame(data, columns=['Month', 'Category', 'Sale Amount'])

df_grouped = df.groupby(['Month', 'Category']).sum().reset_index()

totals = df_grouped.groupby('Month')['Sale Amount'].sum().reset_index()

fig = px.bar(df_grouped, x='Month', y='Sale Amount', color='Category',
             title='Total Sales by Month and Category',
             labels={'Sale Amount': 'Total Sales', 'Month': 'Month'},
             text='Sale Amount')

fig.update_layout(plot_bgcolor='white')
fig.update_traces(textposition='inside', marker=dict(line=dict(color='black', width=1)))

for i, month_total in totals.iterrows():
    fig.add_annotation(x=month_total['Month'], y=month_total['Sale Amount'] + 300,
                       text=f'{month_total["Sale Amount"]:.0f}', showarrow=False, textangle=90)

app = dash.Dash(__name__)

app.layout = html.Div([
    html.H1("Sales Dashboard"),
    dcc.Graph(figure=fig, id='sales-graph')
])

@app.callback(
    Output('sales-graph', 'figure'),
    Input('sales-graph', 'restyleData'),
    State('sales-graph', 'figure'),
    prevent_initial_call=True
)
def annotations(style, fig):
    newFig = Patch()
    totals = []
    for d in fig['data']:
        if 'visible' not in d:
            totals.append(d['y'])
        elif d['visible'] == True:
            totals.append(d['y'])
    if totals:
        newTotals = np.sum(np.array(totals), 0)
        max = np.max(newTotals)
        for i in range(len(newTotals)):
            newFig['layout']['annotations'][i]['y'] = newTotals[i] + (300 * max/4100)
            newFig['layout']['annotations'][i]['text'] = f'{newTotals[i]:.0f}'
        newFig['layout']['yaxis']['range'] = [0, max]
        newFig['data'] = fig['data']
    else:
        for i in range(len(fig['data'][0]['x'])):
            newFig['layout']['annotations'][i]['y'] = 0
            newFig['layout']['annotations'][i]['text'] = f'{0:.0f}'
        newFig['layout']['yaxis']['range'] = [0, 100]
    return newFig

if __name__ == '__main__':
    app.run_server(port=5555, debug=True)

2 Likes

Hi,

There is one issue with this solution.

What if all Categories do not appear in every month?

This solution seems to fail there.

The following updated callback function seems to do the trick. @jinnyzor , please have a look and let me know if I can improve this:

@app.callback(
    Output('sales-graph', 'figure'),
    Input('sales-graph', 'restyleData'),
    State('sales-graph', 'figure'),
    prevent_initial_call=True
)
def annotations(style, figure):
    
    newFig = Patch()
    
    #Reset all annotations
    for i in range(len(figure['data'][0]['x'])):
            newFig['layout']['annotations'][i]['y'] = 0
            newFig['layout']['annotations'][i]['showarrow'] = False
            newFig['layout']['annotations'][i]['text'] = ''
    
    #Initialise totals  dictionary     
    totals = {}
    
    for d in figure['data']:
        
        #Add totals for all visible items

        if 'visible' not in d:        
            index = d['x']
            value = d['y']
            for i in range(len(index)):
                try:
                    totals[index[i]] += value[i]
                except:
                    totals[index[i]] = value[i]
                
        elif d['visible'] == True:    
            index = d['x']
            value = d['y']
            for i in range(len(index)):
                try:
                    totals[index[i]] += value[i]
                except:
                    totals[index[i]] = value[i]
    if totals:
        #Iterate through totals and add annotations to the chart
        for i, (month, annot) in enumerate(totals.items()):
            newFig['layout']['annotations'][i]['y'] = annot
            newFig['layout']['annotations'][i]['x'] = month
            newFig['layout']['annotations'][i]['showarrow'] = True
            newFig['layout']['annotations'][i]['text'] = str(annot)
        newFig['layout']['yaxis']['range'] = [0, max(totals.values())*1.30]
        newFig['data'] = figure['data']        
    else:        
        for i in range(len(figure['data'][0]['x'])):
            newFig['layout']['annotations'][i]['y'] = 0
            newFig['layout']['annotations'][i]['text'] = f'{0:.0f}'
        newFig['layout']['yaxis']['range'] = [0, 100]
    return newFig

Sure, here is a version for you to test:

import dash
from dash import dcc, html, Input, Output, State, Patch, no_update
import plotly.express as px
import pandas as pd
import numpy as np

# Define the range of months
months = pd.date_range(start='2023-01-01', end='2023-12-31', freq='M')

# Define categories
categories = ['Electronics', 'Clothing', 'Books', 'Groceries', 'Furniture']

# Generate random sales amounts
np.random.seed(0)  # For reproducibility
sales_amounts = np.random.randint(100, 1000, size=(len(months), len(categories)))

data = []
for i, month in enumerate(months):
    for j, category in enumerate(categories):
        if not (str(month) == '2023-03-31 00:00:00' and category == 'Books'):
            data.append([month, category, sales_amounts[i][j]])

df = pd.DataFrame(data, columns=['Month', 'Category', 'Sale Amount'])

df_grouped = df.groupby(['Month', 'Category']).sum().reset_index()

totals = df_grouped.groupby('Month')['Sale Amount'].sum().reset_index()

fig = px.bar(df_grouped, x='Month', y='Sale Amount', color='Category',
             title='Total Sales by Month and Category',
             labels={'Sale Amount': 'Total Sales', 'Month': 'Month'},
             text='Sale Amount')

fig.update_layout(plot_bgcolor='white')
fig.update_traces(textposition='inside', marker=dict(line=dict(color='black', width=1)))

for i, month_total in totals.iterrows():
    fig.add_annotation(x=month_total['Month'], y=month_total['Sale Amount'],
                       text=f'{month_total["Sale Amount"]:.0f}', showarrow=True, textangle=90)

app = dash.Dash(__name__)

app.layout = html.Div([
    html.H1("Sales Dashboard"),
    dcc.Graph(figure=fig, id='sales-graph')
])


@app.callback(
    Output('sales-graph', 'figure'),
    Input('sales-graph', 'restyleData'),
    State('sales-graph', 'figure'),
    prevent_initial_call=True
)
def annotations(style, figure):
    newFig = Patch()

    # Initialise totals  dictionary
    totals = {}

    # zero out all annotations
    for i in range(len(figure['layout']['annotations'])):
        newFig['layout']['annotations'][i]['y'] = 0
        newFig['layout']['annotations'][i]['text'] = f'{0:.0f}'
        newFig['layout']['annotations'][i]['showarrow'] = False

    for d in figure['data']:

        # Add totals for all visible items

        if 'visible' not in d:
            index = d['x']
            value = d['y']
            for i in range(len(index)):
                try:
                    totals[index[i]] += value[i]
                except:
                    totals[index[i]] = value[i]

        elif d['visible'] == True:
            index = d['x']
            value = d['y']
            for i in range(len(index)):
                try:
                    totals[index[i]] += value[i]
                except:
                    totals[index[i]] = value[i]
    if totals:
        # Iterate through totals and add annotations to the chart
        for i, (month, annot) in enumerate(totals.items()):
            newFig['layout']['annotations'][i]['y'] = annot
            newFig['layout']['annotations'][i]['x'] = month
            newFig['layout']['annotations'][i]['showarrow'] = True
            newFig['layout']['annotations'][i]['text'] = str(annot)
    newFig['data'] = figure['data']
    return newFig

if __name__ == '__main__':
    app.run_server(port=5555, debug=True)

I adjusted the annotations bit to loop through the annotations instead of the data, since the data could be missing a key record. You also dont need the else statement because you are resetting all the annotations. Using the arrow, you no longer need to make the adjustment to the range (the data performs this action of readjusting the scaling).

I also adjusted the data to test if there was no book data for the month of March. Albeit, you could have just filled blanks with 0s in your live data too.

1 Like