Hello!
Using this link here as a foundation, I am attempting to create a similar visual.
Unlike the link above, I only need one dropdown, which the current code does fine.
The dropdown will only be Title Description (which it currently is), and I’d like it to plot that description’s count, mean, min and max value.
I could be mistaken, but I think the code below represents every entry in the column, regardless of the Title Description. The image doesn’t change, no matter what Job Title I select, because I think it is going through the whole data frame, rather than plotting each row.
Is the issue based off the idea that I’m trying to plot a histogram?
Is it the list comprehension in the response function? The x values for the temp_df? Or something else entirely?
This has been a fun little project to try to learn from. Any assistance here will be greatly appreciated.
If you need any more information, don’t hesitate to let me know!
Thank you.
Sample DF, image and code below:
| Title Description | count | mean | std | min | 25% | 50% | 75% | max | |
|---|---|---|---|---|---|---|---|---|---|
| 0 | * ATTENDING DENTIST | 1.0 | 144040.0000 | NaN | 144040.0 | 144040.0 | 144040.0 | 144040.0 | 144040.0 |
| 1 | *ADM DIR FLEET MAINTENANCE - NM | 1.0 | 129039.0000 | NaN | 129039.0 | 129039.0 | 129039.0 | 129039.0 | 129039.0 |
| 2 | *ADMIN SCHL SECUR MGR-MGL | 1.0 | 143850.0000 | NaN | 143850.0 | 143850.0 | 143850.0 | 143850.0 | 143850.0 |
| 3 | *ADMINISTRATIVE ATTORNEY | 2.0 | 189233.0000 | 24235.377818 | 172096.0 | 180664.5 | 189233.0 | 197801.5 | 206370.0 |
| 4 | *ASIST SYSTMS ANALYST | 2.0 | 61546.0000 | 6747.212906 | 56775.0 | 59160.5 | 61546.0 | 63931.5 | 66317.0 |
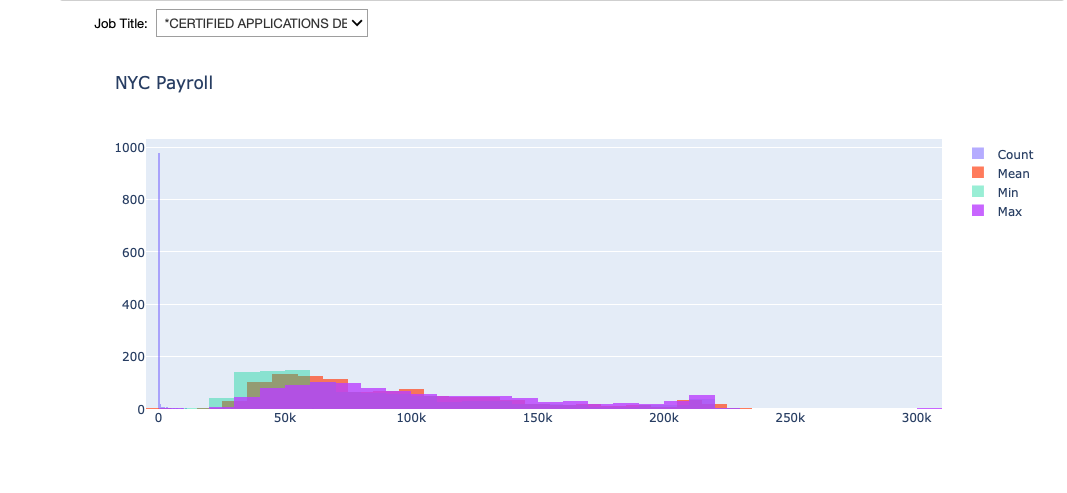
fig = go.Figure()

textbox = widgets.Dropdown(
description = 'Job Title:   ',
value = '* ATTENDING DENTIST',
options = paymath['Title Description'].tolist()
)

textbox2 = widgets.Dropdown(
description = 'Count:   ',
value = 1.0,
options = paymath['count'].tolist()
)

textbox3 = widgets.Dropdown(
description = 'Mean:   ',
value = 144040.0000,
options = paymath['mean'].tolist()
)

textbox4 = widgets.Dropdown(
description = 'Min   ',
value = 144040.0,
options = paymath['min'].tolist()
)

textbox5 = widgets.Dropdown(
description = 'Max:   ',
value = 144040.0,
options = paymath['max'].tolist()
)

trace1 = go.Histogram(x = paymath['count'], opacity = .5, name = 'Count')
trace2 = go.Histogram(x = paymath['mean'], opacity = .7, name = 'Mean')
trace3 = go.Histogram(x = paymath['min'], opacity = .4, name = 'Min')
trace4 = go.Histogram(x = paymath['max'], opacity = .8, name = 'Max')

g = go.FigureWidget(data = [trace1, trace2, trace3, trace4], layout = go.Layout(title = dict(text = 'NYC Payroll')
                                                                           ,barmode = 'overlay'))

def validate():
    if textbox.value in paymath['Title Description']\
       and textbox2.value in paymath['count']\
       and textbox3.value in paymath['mean']\
       and textbox4.value in paymath['min']\
       and textbox5.value in paymath['max']:
       return True
    else:
       return False

def response(change):
    if validate():
       filter_list = [i and j and k and l for i,j,k,l in
                        zip(paymath['Title Description'] == textbox.value,
                        paymath['Count'] == textbox2.value,
                        paymath['Mean'] == textbox3.value,
                        paymath['Max'] == textbox4.value,
                        paymath['Min'] == textbox5.value)]
       temp_df = paymath[filter_list]

       x1 = temp_df['Count']
       x2 = temp_df['Mean']
       x3 = temp_df['Min']
       x4 = temp_df['Max']
       with g.batch_update():
            g.data[0].x = x1
            g.data[1].x = x2
            g.data[2].x = x3
            g.data[3].x = x4
            g.layout.barmode = 'overlay'
            g.layout.xaxis.title = 'Salary'


textbox.observe(response, names = "value")
textbox2.observe(response, names = "value")
textbox3.observe(response, names = "value")
textbox4.observe(response, names = "value")
textbox5.observe(response, names = "value")

container2 = widgets.HBox([textbox])
widgets.VBox([container2, g])