Draw polygon in mapbox with dash/python

Hey,

I’m new to Dash/Plotly and webcoding but I know coding in Python.
I’m trying to write to write an app that shows a map that you are able to draw in. This is the website I’ve come up with:

This is the code for it:

Blockquote import dash
import dash_bootstrap_components as dbc
import dash_core_components as dcc
import dash_html_components as html
import numpy as np
import pandas as pd
import plotly
import chart_studio.plotly as py
import plotly.offline as py
import plotly.graph_objs as go
mapstyle = “mapbox://styles/anjulia/ck6212zuo0n7k1irz2cvd377i”
#set the geo=spatial data
data = [go.Scattermapbox(
lat= [‘57.72849’] ,
lon= [‘11.9745’],
#customdata = train[‘key’],
mode=‘markers’,
marker=dict(
size= 4,
color = ‘gold’,
opacity = .8,
),
)]
#set the layout to plot
layout = go.Layout(autosize=True,
mapbox= dict(accesstoken=“xxx”,
bearing=10,
pitch=60,
zoom=13,
center= dict(lat=57.671667,
lon=11.980833),
style=mapstyle),
#width=1800,
#height=1200,
title = “Karta över Göteborg”
)
fig = go.Figure(data=data, layout=layout)
navbar = dbc.NavbarSimple(
children=[
dbc.NavItem(dbc.NavLink(“Link”, href=“#”)),
dbc.DropdownMenu(
nav=True,
in_navbar=True,
label=“Menu”,
children=[
dbc.DropdownMenuItem(“Entry 1”),
dbc.DropdownMenuItem(“Entry 2”),
dbc.DropdownMenuItem(divider=True),
dbc.DropdownMenuItem(“Entry 3”),
],
),
],
brand=“Demo”,
brand_href=“#”,
sticky=“top”,
)
body = dbc.Container(
[
dbc.Row(
[
dbc.Col(
[
html.H2(“Heading”),
html.P(
“”"
Det här är en app för att se Göteborg inbäddat i en fin liten karta.“”"
),
dbc.Button(“View details”, color=“secondary”),
],
md=4,
),
dbc.Col(
[
html.H2(“Graph”),
dcc.Graph(
figure=fig
),
]
),
]
)
],
className=“mt-4”,
)
app = dash.Dash(name, external_stylesheets=[dbc.themes.BOOTSTRAP])
app.layout = html.Div([navbar, body])
if name == “main”:
app.run_server()

However, I want to be able to include a tool to make it able to draw a polygon and from there get the dimensions from it. I have found this Draw a polygon and calculate its area | Mapbox GL JS | Mapbox and I want it to work similar to that but it is in html. Can I implement this in my dash/python code somehow?

Hi @anjulia! It’s on the roadmap of plotly graphing libraries to add some drawing tools but it’s not implemented yet. In the meantime, what you could do for your project is to add a rectangle or another polygon to the figure (maybe with an annotation “move and rescale the rectangle”) and let the user place the polygon exactly where they want to. In order to make the polygon/rectangle shape editable you have to create the figure with editable:True in its config (something which you can do as in the code below, or inside a Dash app you pass the config object directly to the dcc.Graph)

import pandas as pd
us_cities = pd.read_csv("https://raw.githubusercontent.com/plotly/datasets/master/us-cities-top-1k.csv")

import plotly.express as px

fig = px.scatter_mapbox(us_cities, lat="lat", lon="lon", hover_name="City", hover_data=["State", "Population"],
                        color_discrete_sequence=["fuchsia"], zoom=3, height=300)
fig.update_layout(mapbox_style="open-street-map")
fig.update_layout(margin={"r":0,"t":0,"l":0,"b":0})
fig.add_shape(
        # unfilled Rectangle
            type="rect",
            x0=0.2,
            x1=0.8,
            y0=0.2,
            y1=0.8,
            xref='paper',
            yref='paper',
            line=dict(
                color="RoyalBlue",
            ),
        )
fig.show(config=dict(editable=True))
1 Like

Thank you for your fast response!

Is it possible to set it in coordinates in terms of latitude and longitude instead so the position is “fixed” when moving around in the map?

/Julia

Hi @anjulia,

Another option would be to use Dash Leaflet, which supports (lat,lon) polygons. However, it does not support dragging events at the moment, so you will not be able to achieve the same behavior as in your reference.

\emher

Hi @anjulia

You can draw polygons in lon- lat coordinates, defined asmapbox layers.
Here is an example of recatngular shape over Sweden:

import plotly.graph_objs as go
mapbox_t=open(".mapbox_token").read().rstrip()
data = [go.Scattermapbox(
                    lat=[62.3833], # [57.671667] ,
                    lon=[16.3000], # [11.980833],
                    mode='markers',
                    marker=dict(
                            size= 3,
                            color = 'red',
                            opacity = .8,
                            ))]
#set the layout to plot
layout = go.Layout(autosize=True,
                   mapbox = dict(center= dict(lat=62.3833,     #Set center at Flataklocken
                                 lon=16.3000),        
                                 accesstoken=mapbox_t,
                                 zoom=4,
                                 style='light',
                               ),
                   
                    width=700,
                    height=600,
                    title = 'Sweden')
fig = go.Figure(data=data, layout=layout)

The following function defines a geojson-type dict corresponding to each polygon, no matter how many vertices it has:

def get_polygon(lons, lats, color='blue'):
    if len(lons) != len(lats):
        raise ValueError('the legth of longitude list  must coincide with that of latitude')
    geojd = {"type": "FeatureCollection"}
    geojd['features'] = []
    coords = []
    for lon, lat in zip(lons, lats): 
        coords.append((lon, lat))   
    coords.append((lons[0], lats[0]))  #close the polygon  
    geojd['features'].append({ "type": "Feature",
                               "geometry": {"type": "Polygon",
                                            "coordinates": [coords] }})
    layer=dict(sourcetype = 'geojson',
             source =geojd,
             below='',  
             type = 'fill',   
             color = color)
    return layer

Now let us define a simple polygon:

mylayers =[]
mylayers.append(get_polygon(lons=[14, 16, 16, 14], lats=[58.55, 58.55, 60.6, 60.6],  color='gold'))
fig.layout.update(mapbox_layers =mylayers);

Unfortunately we cannot plot polygons only inside th Goteborg boundaries, because they have very small lengths (less than 1 degree), and plotly cannot draw polygons of such a small area. No error message is displayed, but the polygons are invisible.
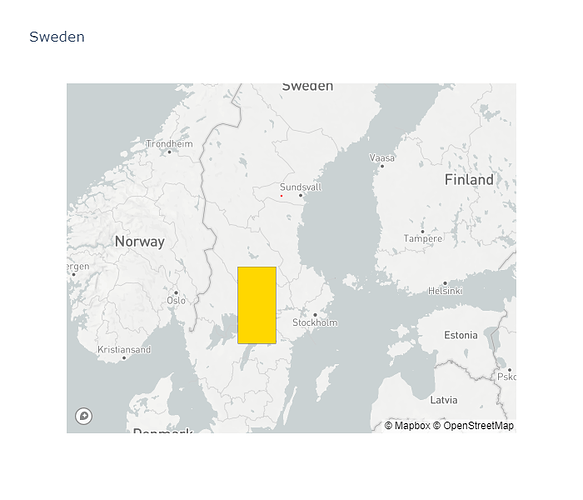
2 Likes

I have created a small example with Dash Leaflet, which does more or less what you want; click on the map to draw the polygon (each click adds a vertex to a polyline) and click on the first point to close it (the polyline is then replaced by a polygon). Here’s the code,

import dash
import dash_leaflet as dl
import dash_html_components as html

from dash.dependencies import Output, Input, State
from dash.exceptions import PreventUpdate

MAP_ID = "map-id"
POLYLINE_ID = "polyline-id"
POLYGON_ID = "polygon-id"

dummy_pos = [0, 0]
dlatlon2 = 1e-6  # Controls tolerance of closing click

app = dash.Dash()
app.layout = html.Div([
    dl.Map(id=MAP_ID, center=[57.671667, 11.980833], zoom=16, children=[
        dl.TileLayer(),  # Map tiles, defaults to OSM
        dl.Polyline(id=POLYLINE_ID, positions=[dummy_pos]),  # Create a polyline, cannot be empty at the moment
        dl.Polygon(id=POLYGON_ID, positions=[dummy_pos]),  # Create a polygon, cannot be empty at the moment
    ], style={'width': '1000px', 'height': '500px'}),
])


@app.callback([Output(POLYLINE_ID, "positions"), Output(POLYGON_ID, "positions")],
              [Input(MAP_ID, "click_lat_lng")],
              [State(POLYLINE_ID, "positions")])
def update_polyline_and_polygon(click_lat_lng, positions):
    if click_lat_lng is None or positions is None:
        raise PreventUpdate()
    # On first click, reset the polyline.
    if len(positions) == 1 and positions[0] == dummy_pos:
        return [click_lat_lng], [dummy_pos]
    # If the click is close to the first point, close the polygon.
    dist2 = (positions[0][0] - click_lat_lng[0]) ** 2 + (positions[0][1] - click_lat_lng[1]) ** 2
    if dist2 < dlatlon2:
        return [dummy_pos], positions
    # Otherwise, append the click position.
    positions.append(click_lat_lng)
    return positions, [dummy_pos]


if __name__ == '__main__':
    app.run_server(debug=True)

and a screenshot :slight_smile:

This looks extremly useful. Would it be possible to visualize the polygon i 3D by adding a height like a building? I am thinking of eegeo for example.
Max

I haven’t had the need to work in 3D, so the functionality is not implemented in Dash Leaflet. However, as eegeo is actually based on Leaflet, I guess it could be. It would require some work though. I would be interested to see the final solution, if you end up pursing that route :slight_smile:

Hum I tried and it does not seem to work (you cannot pass xref='lat' and if you do xref='x' te behaviour is weird). Since modifying a shape triggers a relayout event you could make the conversion between the axis range and the shape but this is convoluted.

Why is it not possible to draw small polygons? Will it ever be possible to draw very small polygons? Dash-Leaflet doesn’t really fit my needs…

Thanks for providing an example using the polygon!

Is there a way to clear the click_lat_lng value when resetting the polygon? When I click the polygon, to clear it, that becomes the next point in the polyline. I would like to reset the value or clear it if possible?

Thank in advance for any advice!

EDIT: Worked it out. Added a state to check the polygon array, so if it’s not set to the dummy_pos, then reset values. Then the next click will start the new boundary coordinate set.

Cheers

@app.callback([Output(POLYLINE_ID, "positions"), Output(POLYGON_ID, "positions")],
    Input(MAP_ID, "click_lat_lng"),
    [State(POLYLINE_ID, "positions"),
    State(POLYGON_ID, "positions")],
    prevent_initial_callbacks=True)
def update_polyline_and_polygon(click_lat_lng, positions, polygon_state):
    if click_lat_lng is None or positions is None:
        raise PreventUpdate()
    # Reset position arrays if polygon array not set to dummy_pos
    if polygon_state[0] != dummy_pos:
        return [dummy_pos], [dummy_pos]
    # On first click, reset the polyline.
    if len(positions) == 1 and positions[0] == dummy_pos:
        return [click_lat_lng], [dummy_pos]
    # If the click is close to the first point, close the polygon.
    dist2 = (positions[0][0] - click_lat_lng[0]) ** 2 + (positions[0][1] - click_lat_lng[1]) ** 2
    if dist2 < dlatlon2:
        return [dummy_pos], positions
    # Otherwise, append the click position.
    positions.append(click_lat_lng)
    return positions, [dummy_pos]
1 Like

Could you elaborate on the use case? A new MeasureControl, that makes it easy to draw polygons, was recently added. It might suit your needs :slight_smile:

Is there a way to extend the MeasureControl just to draw the polygon and do your own analysis with the returned area (lat/lon) instead of the default measuring

You could do that in the JavaScript layer, but not in the Python layer.

hello, i like dash and plotly so much. recently i want to use plotly draw polygon but found it’s not possible as :

  1. if use Scattermapbox and fill=‘toself’ but it actually not polygon with proper info. for example when i select by rectangle , it returns point lon, lat not polygon info with name.
  2. also fill=‘toself’ way i cannot use select to choose one polygon
    is there any way to draw batch maybe 2000+ polygons.
    thanks.

yes, this is possible relayoutData.