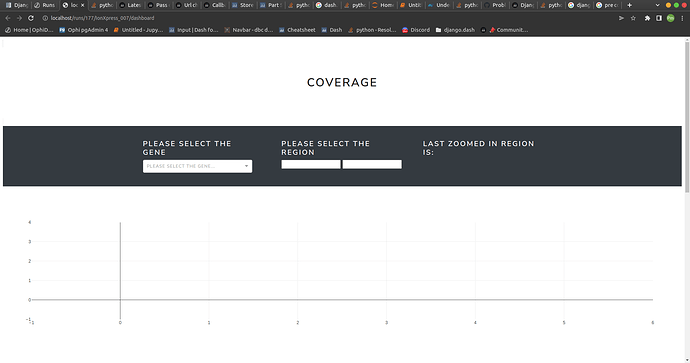
So i’ve had an issue where i couldn’t access my initial arguments but after i got some help in this forum i was able to access it.
Now i’m having a problem where sometimes the context doesnt load in my dash app but other times it will, it feels like it’s random.
I will provide all my code below and some screenshots with an example of my dash app
VIEWS.PY
def dashboa(requests, **kwargs):
    id_ = kwargs.get('pk')
    barcode_ = kwargs.get('barcode')
    rundata = get_object_or_404(models.RunData, run_id=id_)
    runsample = get_object_or_404(models.RunSampleData, rundata=rundata, barcode=barcode_)
    file_path = get_file(runsample)

    df = pd.read_csv (file_path)
    context={}
    context = {"dash_context":
                {"bed_file_path":
                    {"children": file_path}}}
    print('ESTA PARTE É DO DJANGO', context)


    return render(requests,'runs/dash.html', context=context)
DASH.APP
import dash_bootstrap_components as dbc
import dash
from dash.dependencies import Input, Output
import dash_core_components as dcc
import dash_html_components as html
import plotly.graph_objects as go
import plotly.express as px
import pandas as pd
import json
from django_plotly_dash import DjangoDash
from . import views

app =  DjangoDash(name='dash_app', external_stylesheets=[dbc.themes.LUX])


# class DbResult:
#     def __init__(self, data=None):
#         self.data = pd.read_csv('HD40755__IonXpress_009__Auto_user_GSS5-0407-124-CHIP1_03022022_393_333__basedepth.csv', header=None)

#     def store(self, data):
#         self.data = data

# db_result = DbResult()

# db_result.data


df = pd.read_csv('HD40755__IonXpress_009__Auto_user_GSS5-0407-124-CHIP1_03022022_393_333__basedepth.csv', header=None)

df.columns = ["Chromossome", "Region", "Coverage"]
df=df.sort_values(by=['Region'])

dfR=pd.read_csv('ampliconsRightChr.csv')
dfR.columns = ["Chromossome", "Initial Position", "Final Position", 'coverage_mean','coverage_min','coverage_max']

dfgene=pd.read_csv('GenePosition.csv')
dfgene = dfgene.sort_values('Initial_Position', ascending=True).drop_duplicates('Gene')
dfgene['Chromossome'] = 'chr' + dfgene['Chromossome'].astype(str)


# def handle_data():

#     df = pd.read_csv('HD40755__IonXpress_009__Auto_user_GSS5-0407-124-CHIP1_03022022_393_333__basedepth.csv', header=None)
#     df.columns = ["Chromossome", "Region", "Coverage"]
#     df=df.sort_values(by=['Region'])
#     dfR=pd.read_csv('ampliconsRightChr.csv')
#     dfR.columns = ["Chromossome", "Initial Position", "Final Position", 'coverage_mean','coverage_min','coverage_max']
#     dfgene=pd.read_csv('GenePosition.csv')
#     dfgene = dfgene.sort_values('Initial_Position', ascending=True).drop_duplicates('Gene')
#     dfgene['Chromossome'] = 'chr' + dfgene['Chromossome'].astype(str)
#     lastdf = margeDF(minus1,plus1, dfR, df)
#     lastdf = lastdf.sort_values('Coverage', ascending=False).drop_duplicates('Region').sort_index()
#     lastdf = lastdf.sort_values(by=['Region'])

#     return (df,dfR,dfgene,lastdf)


def plus1(dataframe):
    data = []
    for index, row in dataframe.iterrows():
        data.append([row['Chromossome'] ,row['Initial Position'] + 1, row['Final Position'] + 1])
    df = pd.DataFrame(data)
    df.columns = ["Chromossome", "Initial Position", "Final Position"]
    return(df)

def minus1(dataframe):
    data = []
    for index, row in dataframe.iterrows():
        data.append([row['Chromossome'] ,row['Initial Position'] - 1, row['Final Position'] - 1])
    df = pd.DataFrame(data)
    df.columns = ["Chromossome", "Initial Position", "Final Position"]
    return(df)

def margeDF (minus1,plus1, df1, dfbed):
    df2 = plus1(df1)
    df3 = minus1(df1)
    df3 = df3.melt(id_vars=["Chromossome"],
        value_name="Region")
    df3 = df3[['Chromossome','Region']]
    df3['Chromossome'] = 'chr' + df3['Chromossome'].astype(str)
    df2 = df2.melt(id_vars=["Chromossome"],
        value_name="Region")
    df2 = df2[['Chromossome','Region']]
    df2['Chromossome'] = 'chr' + df2['Chromossome'].astype(str)
    frames = [df2, df3]
    result = pd.concat(frames)
    frames2 = [result, dfbed]
    result2 = pd.concat(frames2)
    result2 = result2.reset_index(drop=True).fillna(0).sort_values(by=['Region'])
    return result2

lastdf = margeDF(minus1,plus1, dfR, df)
lastdf = lastdf.sort_values('Coverage', ascending=False).drop_duplicates('Region').sort_index()
lastdf = lastdf.sort_values(by=['Region'])

app.layout = html.Div(id = 'parent', children = [
        html.Span(html.H1(id = 'H1', children = 'coverage', style = {'textAlign':'center','marginTop':80,'marginBottom':80}), className="border rounded"),
        html.Div(id='bed_file_path'),
        dcc.Store(id='intermediate-value', storage_type='local'),
        dbc.NavbarSimple(children=[
        html.Div(style={'display': 'inline-block', 'vertical-align': 'top', 'margin-right': '5vw'},children=[
            html.H4("Please select the Gene", style={'color':"white"}),
            dcc.Dropdown(
            options=[{'label': c, 'value': c} for c in sorted(dfgene['Gene'].unique())],
            optionHeight=35,
            searchable=True,
            search_value='',
            placeholder='Please select the Gene...',
            clearable=True,
            style={'width':"100%"},  id='dropdownGene'),
        ]),

        html.Div(style={'display': 'inline-block', 'vertical-align': 'top'},className='row',children=[
        html.H4("", style={}),
        html.H5(id='chromossome-data', style={'color':"white", 'margin-right': '2em', 'marginTop':60})
        ]),
        html.Div(style={'display': 'inline-block', 'vertical-align': 'top'},className='row',children=[
                html.H4("Please select the Region", style={'margin-right': '2em', 'color':"white"}),
                dcc.Input(
                    id="initial", type="number",style={'marginRight':'5px','display': 'flex', 'float':'left'},
                ),
                dcc.Input(
                    id="end", type="number",style={'marginRight':'5px', 'display': 'flex', 'float':'left'},
                ),
            ]),
        html.Div(style={'display': 'inline-block', 'vertical-align': 'top'},children=[
                html.H4("Last Zoomed in Region is:", style={'color':"white", 'margin-left': '2em'}),
                html.H5(id='relayout-data', style={'color':"white", 'margin-left': '2em'})
                ]),
            ],
            sticky="top",
            color="dark",
            dark=True,
            style={'height': '10.5rem', 'display': 'flex'}
            ),
        html.Div(style={},children=[
            dcc.Graph(id = 'spec_coverage'),
        ]),
        ])


@app.callback(
    Output('intermediate-value', 'data'),
    Input('bed_file_path', 'children'))

def clean_data(file_path):
    df_file_path = file_path
    for x in range(0,20):
        print(x)
    if df_file_path is None:
        print('Refresh Page')
    else:
        print(df_file_path)
        return df_file_path


@app.callback(
    Output('relayout-data', 'children'),
    [Input('spec_coverage', 'relayoutData'),
    Input('dropdownGene', 'value')])


def display_relayout_data(relayoutData, gene):
    if gene is None:
        relayoutData['xaxis.range[0]']=None
        relayoutData['xaxis.range[1]']=None
        return html.Div([
        '',
    ])
    elif relayoutData is not None:
        lastdff = dfgene[dfgene.Gene == gene]
        chr = lastdff['Chromossome'].values[0]
        x0 = relayoutData['xaxis.range[0]']
        x0 = int(x0)
        x1 = relayoutData['xaxis.range[1]']
        x1 = int(x1)
        return html.Div([
            '{}:{}-{}'.format(chr,x0,x1),
        ])


# @app.callback(
#     Output('dropdownGene', 'options'),
#     Input('dropdown', 'value')
# )
# def set_Gene_options(chromossome):
#     lastdff = dfgene[dfgene.Chromossome == chromossome]
#     #print(lastdff)
#     return [c for c in sorted(lastdff['Gene'].unique())]


@app.callback(
    [Output('initial', 'value'),
    Output('end', 'value')],
    Input('dropdownGene', 'value')
)

def set_Input_values(gene):
    if gene is None:
        an_integer_initial = None
        an_integer_final = None
        return an_integer_initial,an_integer_final
    else:
        lastdff = dfgene[dfgene.Gene == gene]
        #print(lastdff['Initial_Position'], lastdff['Final_Position'])
        init = lastdff['Initial_Position']
        strings = [str(begs) for begs in init]
        a_string = "". join(strings)
        an_integer_initial = int(a_string)
        # print(an_integer)
        fin = lastdff['Final_Position']
        strings_final = [str(begs) for begs in fin]
        a_string_final = "". join(strings_final)
        an_integer_final = int(a_string_final)
        return an_integer_initial,an_integer_final
# print(an_integer_final)


@app.callback(
    Output('chromossome-data', 'children'),
    Input('dropdownGene', 'value'))


def display_chromossome_data(gene):
    if gene is None:
        return html.Div([
        '',
    ])
    else:
        lastdff = dfgene[dfgene.Gene == gene]
        chr = lastdff['Chromossome'].values[0]
        return html.Div([
            '{}:'.format(chr),
        ])


@app.callback(
    Output('spec_coverage', 'figure'),
    # Input('spec_slider', 'value'),
    # Input('dropdown', 'value'),
    [Input("initial", "value"),
    Input("end", "value"),
    Input('dropdownGene', 'value'),
    Input('intermediate-value', 'data')])


def plot_data(beg, fin, dropGene, df_file_path):
    for x in range(50,70):
        print(x)

    y = df_file_path
    print(y)
    df_teste = pd.read_csv(y)
    df_first_3 = df_teste.head(3)
    print(df_first_3)
    dff=lastdf
    dffGene = dfgene[(dfgene['Gene'] == dropGene)]
    GeneInitPOS = dffGene['Initial_Position'].min()
    GeneFinPOS = dffGene['Final_Position'].max()
    dfff=dff[(dff['Region'] >= GeneInitPOS) & (dff['Region'] <= GeneFinPOS)]

    # dff=dfff['Region']>=beg & dfff['Region']<=fin
    dffff=dfff[(dfff['Region'] >= beg) & (dfff['Region'] <= fin)]
    fig2 = go.Figure()

    fig2.add_trace(go.Scatter(x=dffff['Region'],y=dffff['Coverage'], fill='tozeroy', name='Coverage'))

    fig2.update_layout(
                      xaxis_title = 'Region',
                      yaxis_title = 'Coverage',
                      )

    # full_fig = fig2.full_figure_for_development()
    # print(full_fig.layout.xaxis.range)
    return fig2
DASH_HTML
{%load plotly_dash%}


{% block content %}


      {%plotly_app name="dash_app" initial_arguments=dash_context ratio=1 %}


{% endblock %}

