How to display all the previous month data with the selected date’s data in plotly python?
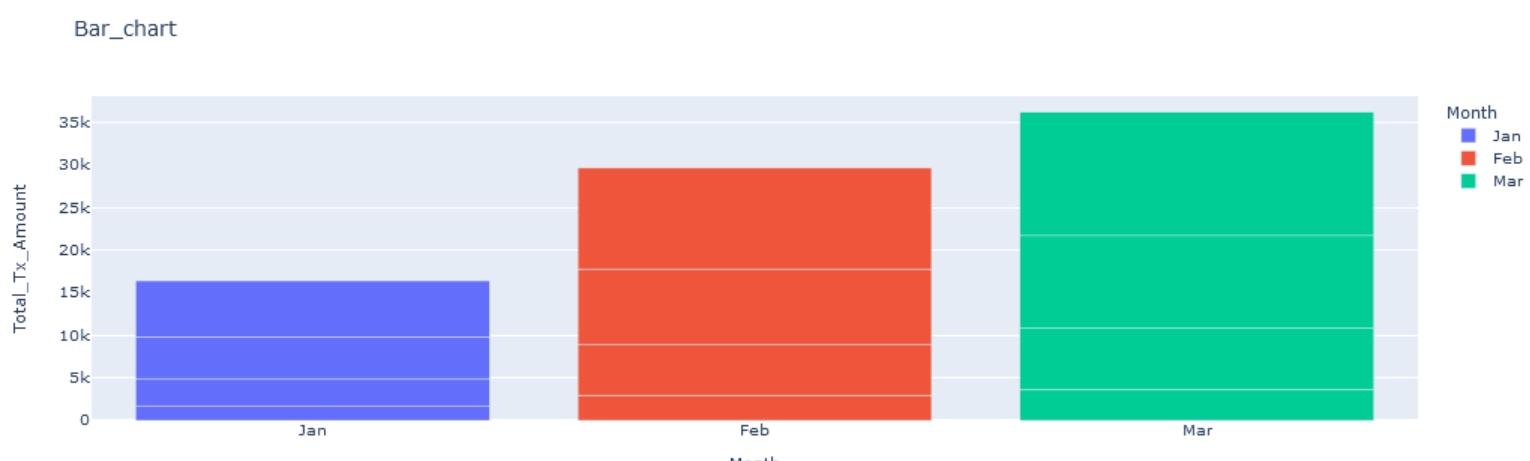
Let says selected date, 15/03/2022, so, the bar chart should show all the previous whole month data (Jan, Feb) and for Mar, data should be show month-to-date data (01/03/2022 to 15/03/2022).
This is what I can get now, but it is not what I want. For Jan and Feb, the data is correct as it taking the whole month data, but for the Mar, it also taking the whole month data instead of month-to-date.
Code as per below:
(1) this code will get month-to-date data (01/03/2022 to 15/03/2022)
month_category = list(df['Month'].unique())
date_category = list(df['Settlement_Date'].unique())

bar_groupby = df.groupby(['Settlement_Date','Date','Month'])['MTD'].agg(['sum']).reset_index().rename(columns={'sum':'Total_Tx_Amount'})


app.layout = dbc.Container([
dbc.Row([
    dbc.Col([
        html.H3('Month'),
        html.Br(),

        dcc.Dropdown(id='month_dd', value= 'Jan',
                      options = [{'label':x, 'value':x}
                                for x in month_category],

                      searchable = True, search_value='',
                      placeholder= 'Please select ...'

                      ),
        html.Br(),

        html.H3('Date'),
        html.Br(),

        dcc.Dropdown(id='date_dd')

            ])
        ]),


dbc.Row([
    dbc.Col([
        html.P("Bar Chart:",
                style={"textDecoration":"underline"}),


        dcc.Graph(id='bar-fig', figure={})

            ])
        ])
])

@app.callback(
    Output('date_dd','options'),
    Input('month_dd', 'value')
)


def update_dd (month_dd):
    month_date= df.drop_duplicates(['Month','Settlement_Date'], inplace= False)
    relevant_date= month_date[month_date['Month']== month_dd]['Settlement_Date'].values.tolist()
    date_option= [dict(label=x,value=x)for x in relevant_date]


    return date_option

@app.callback(
    Output('bar-fig', 'figure'),
    Input('date_dd', 'value')
)


def update_graph(selection):
    if len (selection) ==0:
        return dash.no_update

    else:
        dff = bar_groupby[bar_groupby['Settlement_Date'] == selection]
        fig = px.bar(dff, x='Month', y='Total_Tx_Amount', title='Bar_chart', color='Month')

        return fig
(2) this code will get data for all the month (Jan, Feb, Mar)
month_category = list(df['Month'].unique())
date_category = list(df['Settlement_Date'].unique())


bar_groupby = df.groupby(['Settlement_Date','Date','Month'])['MTD'].agg(['sum']).reset_index().rename(columns={'sum':'Total_Tx_Amount'})


app.layout = dbc.Container([
    dbc.Row([
        dbc.Col([
            html.H3('Month'),
            html.Br(),

            dcc.Dropdown(id='month_dd', value= 'Jan',
                      options = [{'label':x, 'value':x}
                                for x in month_category],

                      searchable = True, search_value='',
                      placeholder= 'Please select ...'

                      ),
        html.Br(),

        html.H3('Date'),
        html.Br(),

        dcc.Dropdown(id='date_dd')

            ])
        ]),


dbc.Row([
    dbc.Col([
        html.P("Bar Chart:",
                style={"textDecoration":"underline"}),


        dcc.Graph(id='bar-fig', figure={})

            ])
        ])

  ])

@app.callback(
    Output('date_dd','options'),
    Input('month_dd', 'value')
    )


def update_dd (month_dd):
    month_date= df.drop_duplicates(['Month','Settlement_Date'], inplace= False)
    relevant_date= month_date[month_date['Month']== month_dd]['Settlement_Date'].values.tolist()
    date_option= [dict(label=x,value=x)for x in relevant_date]


    return date_option

@app.callback(
    Output('bar-fig', 'figure'),
    Input('date_dd', 'value')
)


def update_graph(selection):
    if len (selection) ==0:
        return dash.no_update

    else:
        fig = px.bar( bar_groupby, x='Month', y='Total_Tx_Amount', title='Bar_chart', color='Month')
        return fig
both code getting the correct data, but I m not able to join both data into a same chart.
Can anyone assist or advise on this?