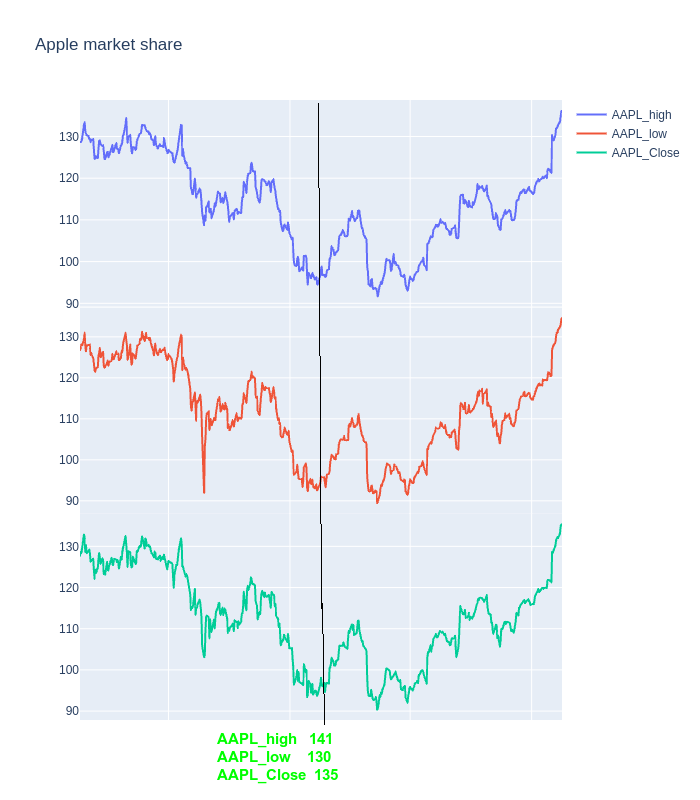
I am working on data visualization using plotly. I need to plot 3 variables in 3 separate plots and whever cursor is placed, corresponding values of three variables need to be displayed at the bottom of the figure. below is the code for generating subplots.
import plotly
import plotly.graph_objs as go
import pandas as pd
import plotly.graph_objects as go
from plotly.subplots import make_subplots

import pandas as pd
import re

df = pd.read_csv("finance-charts-apple.csv")

fig = make_subplots(
    rows=3, cols=1,
    shared_xaxes=True,
    vertical_spacing=0.0,
    horizontal_spacing = 0.0,
    specs=[[{"type": "scatter"}],
           [{"type": "scatter"}],
           [{"type": "scatter"}]])

fig.add_trace(
    go.Scattergl(
        x=df.Date,
        y=df['AAPL.High'],
        mode="lines",
        name="AAPL_high"
    ),
    row=1, col=1
)

fig.add_trace(
    go.Scattergl(
        x=df.Date,
        y=df['AAPL.Low'],
        mode="lines",
        name="AAPL_low"
    ),
    row=2, col=1
)

fig.add_trace(
    go.Scattergl(
        x=df.Date,
        y=df['AAPL.Close'],
        mode="lines",
        name="AAPL_Close"
    ),
    row=3, col=1
)

fig.update_layout(
    height=800,
    showlegend=True,
    title_text="Apple market share",
    hovermode= 'x unified',
    hoverinfo= "x+y",
    spikedistance= -1,
    xaxis = dict(
            showspikes = True,
            spikemode = 'across + toaxis',
            spikesnap = 'cursor',
            showline= True,
            showgrid = True,
            spikedash = 'solid'))

fig.update_xaxes(matches='x')
fig.update_traces(xaxis='x1')
fig.show()
plotly.offline.plot(fig)
As per above code, I am able to plot 3 sub plots with vertical hover across all the sub plots. What I want to know is, is there any way to display all the 3 traces values for particular x value, at the bottom of the figure?