Different customization of each tick on graph

Hello everyone,

I have a situation where i need to customizes ease tick differently on yaxis,I am unable to find any reference or example for the same.
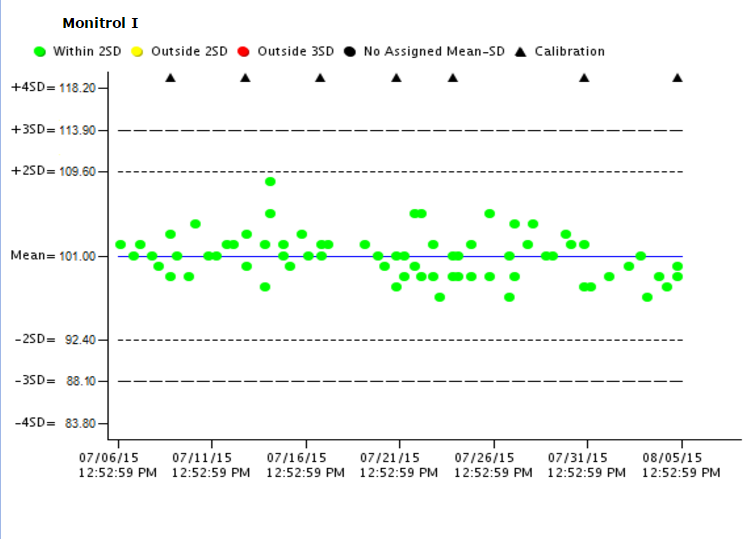
Any input will be appreciated.Following is the graph that i need to create.You can see the y axis ,it has tick with different values which are not numbers.

Thanks

Probably best to use tickvals and ticktext in this case. See example: http://codepen.io/etpinard/pen/eZMBpZ

1 Like

Hey @etienne,
Is there any way to format x axis ticks so that date can come on first row and time can come on second row as shown in the graph?

Not at the moment unfortunately.