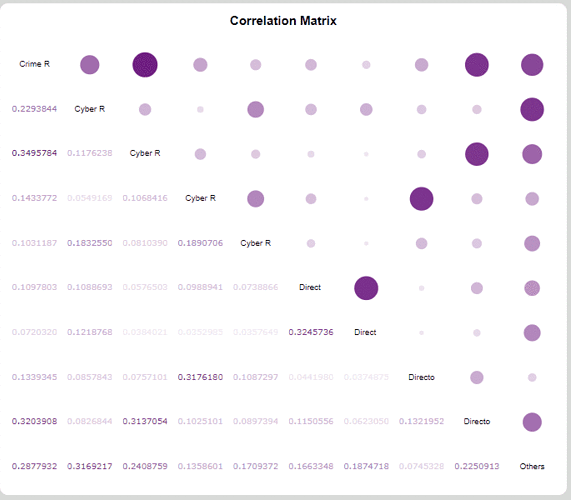
Is there any way to use different chart types in splom chart ?
Like , if I don’t want to use scatter plots , but something else ?
Also , is it possible to show histogram in middle , instead of straight lined scatter plot
Something like exists in python , is it configurable in js Please let me know , thanks .\


