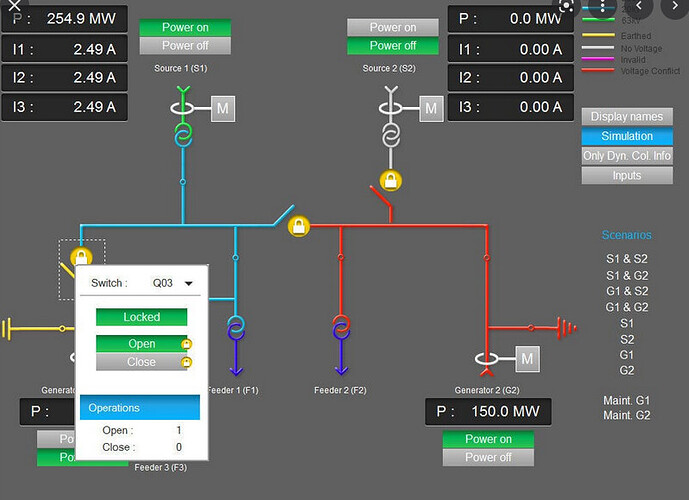
Hello everyone, I’m wondering if there is a way or workaround having a diagram like setup in dash apps. like below. The functionality i’m looking is to be able to insert lines, daq objects on free position, OR insert a draw.io diagram.
I have all the values over modbus protocol using pymodbus library, i just need to position accordingly.
Any suggestions to have something close to this ?
Hi! I have been working in something like this. I don’t think there is a simple way of doing it, but at least the dynamic update of elements in a diagram is quite straightforward and can be automated. As of right now I have a diagram that dynamically updates its values in some text boxes like this. The approach is:
Diagram preparation
The idea is to have an svg diagram where the parts that need updating can be identified in order to later on manipulate those parts. The manipulation part requires to do some xml insertion and it’s a tedious process (at least it was for me, and I still did not even get it correctly, the text overflows when it should adjust its size to fit inside the text box as well as the placement of elements, I would like to make it relative for each box but still didn’t manage). So roughly the steps are:
-
Design the diagram using draw.io
-
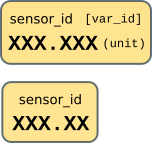
Design a template for a box that displays the updating data and assign it a known unique identifier (link), as of right now I have two templates, a “normal” and a compact version:
-
Then it comes the xml editing part, the idea is to find the unique identifier and add some svg code for the templates (as child elements):
nsmap = {
    'sodipodi': 'http://sodipodi.sourceforge.net/DTD/sodipodi-0.dtd',
    'cc': 'http://web.resource.org/cc/',
    'svg': 'http://www.w3.org/2000/svg',
    'dc': 'http://purl.org/dc/elements/1.1/',
    'xlink': 'http://www.w3.org/1999/xlink',
    'rdf': 'http://www.w3.org/1999/02/22-rdf-syntax-ns#',
    'inkscape': 'http://www.inkscape.org/namespaces/inkscape'
    }

# Read diagram
diagram_file = get_diagram_file()

# For each variable
for var in config["medidas"].keys():
    sensor_id = config["medidas"][var]["sensor_id"]

    # Find the element by its unique identifier (in my case "cell-{}" and some name)
    tag_elem = diagram_file.xpath(f'//svg:g[@id="cell-{sensor_id}"]',namespaces=nsmap)

    if tag_elem:
        print('Found')

        for child in tag_elem[0]:

            if 'rect' in child.tag:
                x = float(child.get('x'))
                y = float(child.get('y'))

                # Insert group of tag's text

                # Setup tag type
                if "tag_type" in config["medidas"][var].keys():
                    tag_type = config["medidas"][var]["tag_type"]
                else:
                    tag_type = 'full'

                child.addnext( etree.fromstring(generate_tag_string(sensor_id, container_pos=[x, y], tag_type=tag_type)) )
                print('Inserted text group')

open("assets/scada_diagram.svg","w").write(etree.tostring(diagram_file).decode('utf-8'))
where the function generate_tag_string is the one that contains the template svg code:
def generate_tag_string(sensor_id, container_pos=[0,0], tag_type='full'):
    if tag_type == 'full':
        sensor_id_deviation = [16, 20]
        var_id_deviation    = [23*4, 18]
        value_deviation  = [2*4, 9.5*5]
        unit_deviation   = [25.2*4, 9.2*5]

        tag = f"""
                <g transform="translate({container_pos[0]},{container_pos[1]})" id="{sensor_id}_g6030">
                    <text
                        xml:space="preserve"
                        id="{sensor_id}__text_sensor_id"
                        style="text-align:center;writing-mode:lr-tb;text-anchor:start;font-size:14px;line-height:1.25;font-family:sans-serif;word-spacing:0px;white-space:pre;shape-inside:url(#rect269533)"><tspan
                        template-id="{sensor_id}_sensor_id"
                        x="{sensor_id_deviation[0]}"
                        y="{sensor_id_deviation[1]}"
                        id="{sensor_id}_tspan995">sensor_id  [var_id]</tspan></text>
                    <text
                        xml:space="preserve"
                        id="{sensor_id}_text_unit"
                        style="text-align:center;writing-mode:lr-tb;text-anchor:start;font-size:12px;line-height:1.25;font-family:'Liberation Mono';-inkscape-font-specification:'Liberation Mono, Normal';word-spacing:0px;white-space:pre;shape-inside:url(#rect303329-6);display:inline"><tspan
                        template-id="{sensor_id}_unit"
                        x="{unit_deviation[0]}"
                        y="{unit_deviation[1]}"
                        id="{sensor_id}_tspan999">(unit)</tspan></text>
                    <text
                        xml:space="preserve"
                        id="{sensor_id}_text_value"
                        style="text-align:center;writing-mode:lr-tb;text-anchor:start;font-style:normal;font-variant:normal;font-weight:bold;font-stretch:normal;text-align:start;writing-mode:lr-tb;text-anchor:start;font-size:21.3333px;line-height:1.25;font-family:'Liberation Mono';-inkscape-font-specification:'Liberation Mono Bold';word-spacing:0px;white-space:pre;shape-inside:url(#rect333487)"><tspan
                        template-id="{sensor_id}_value"
                        x="{value_deviation[0]}"
                        y="{value_deviation[1]}"
                        id="{sensor_id}_tspan1001">XXX.XXX</tspan></text>
                </g>
        """
    elif tag_type == 'compact':
        sensor_id_deviation = [16, 20]
        value_deviation  = [2*4, 9.5*5]

        tag = f"""
                <g transform="translate({container_pos[0]},{container_pos[1]})" id="{sensor_id}_g6030">
                    <text
                        xml:space="preserve"
                        id="{sensor_id}__text_sensor_id"
                        style="text-align:center;writing-mode:lr-tb;text-anchor:center;font-size:14px;line-height:1.25;font-family:sans-serif;word-spacing:0px;white-space:pre;shape-inside:url(#rect269533)"><tspan
                        template-id="{sensor_id}_sensor_id"
                        x="{sensor_id_deviation[0]}"
                        y="{sensor_id_deviation[1]}"
                        id="{sensor_id}_tspan995">sensor_id</tspan></text>
                    <text
                        xml:space="preserve"
                        id="{sensor_id}_text_value"
                        style="text-align:center;writing-mode:lr-tb;text-anchor:center;font-style:normal;font-variant:normal;font-weight:bold;font-stretch:normal;text-align:start;writing-mode:lr-tb;text-anchor:start;font-size:21.3333px;line-height:1.25;font-family:'Liberation Mono';-inkscape-font-specification:'Liberation Mono Bold';word-spacing:0px;white-space:pre;shape-inside:url(#rect333487)"><tspan
                        template-id="{sensor_id}_value"
                        x="{value_deviation[0]}"
                        y="{value_deviation[1]}"
                        id="{sensor_id}_tspan1001">XXX.XXX</tspan></text>
                </g>
        """

    else: raise Exception(f'Unknown tag type: {tag_type}')

    return tag
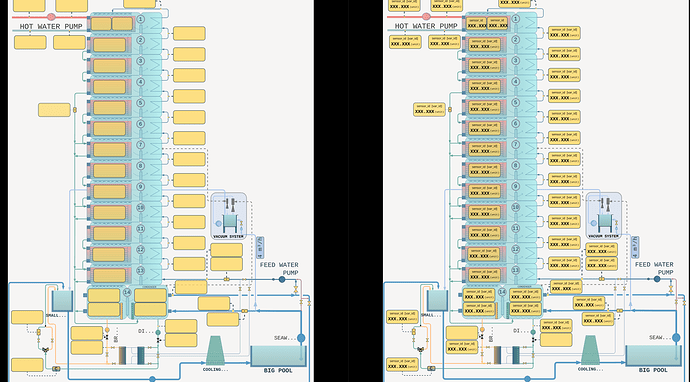
Done this, you go from the image on the left to the one on the right:
Replacing the XXX.XX with values is done with a callback in dash.
Dash implementation
The idea is that using svglue one can, at each callback call, replace the values for each element. First in the layout a Iframe element is used:
html.Iframe(
        src='data:image/svg+xml;base64,{}'.format(base64.b64encode(str.encode(str(scada_diagram))).decode()),
        id='scada_diagram',
        width='1450',
        height='1850'
)
And for the callback:
@app.callback(Output('scada_diagram', 'src'),
                  Input('scada-diagram_update-interval', 'n_intervals'),
                  prevent_initial_call=True)
    def update_scada_diagram(
            for var_name in group['medidas']:
                var = group['medidas'][var_name]
                try:
                    scada_diagram.set_text(f"{var['sensor_id']}_value", str( round(var["values"][-1], 3) ))
                except KeyError as e:
                    # logging.error(f"Error setting text for {var_name}: {e}. Probably template-id not in diagram svg file")
                    pass
                except TypeError as e:
                    # logging.error(f"Error setting text for {var_name}: {e}. Variable has no value, probably not found in OPC server")

                    pass
While the diagram is initialized with the values that only need to be setup once:
def initialize_tags(config):
    for var_name in config["medidas"]:
        var = config["medidas"][var_name]
        try:
            if "tag_type" in var.keys():
                if var["tag_type"] == "compact":
                    scada_diagram.set_text(f"{var['sensor_id']}_sensor_id", var["sensor_id"])
                    logging.info('Setting compact tag for sensor_id: {}'.format(var["sensor_id"]))
            else:
                scada_diagram.set_text(f"{var['sensor_id']}_sensor_id", f'{var["sensor_id"]}  [{var["var_id"]}]')
                scada_diagram.set_text(f"{var['sensor_id']}_unit", f'({var["unit"]})')
        except KeyError as e:
            logging.error(f"Error setting text for {var_name}: {e}. Probably template-id not in diagram svg file")
This is still a work in progress, I need to better implement the svg code so that text fits the text box and does not overflow and next I would like to have clickcable elements in the svg like here, I still need to study it better.
Here is the link for svglue, as a new user I reached the limit on links ![]()
nice work Juan ! thanks for your input.
I will see what i can achieve, considering my experience is dash dcc and now i do a little bootstrap dbc.
Good luck!
Hi Bambos,
I was wondering how your project is coming along? Did you manage to implement your mini SCADA?
I am interested to do a similar thing.
Please let me know any link or info in the web that I can use
Thanks
Hi JuanMiguel,
It s really interesting the amount of work you have done to link the svg’s and data. Have you managed to finished your code? can you share it? Any link that you can recomend in regards on this topic?
Thanks
Ismael
@staff2025 Hello there.
Using dash bootstrap components and daq in parallel with pymodbus library i managed to have some progress. But not 100% diagramatic view like traditional scada.
I’m wondering if dash can somehow render html diagrams prepared by draw.io and pass values on to that diagram. (???)


