Hello to all!
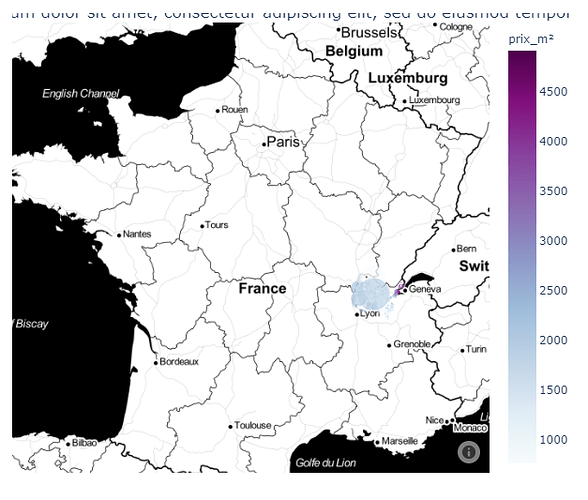
I hope you’re fine. I am struggling to get the desgin I want for me map. The pure map (or “canvas” if you prefere) is exactly like I want to it. Nevertheless, I have:
- my vertical legend on the right of it whereas I would prefer it to be horizontal and at the bottom of my map.
- a problem a bit different for my title: it displays within my map (at the top, but inside it) and I would prefer it to be at the top but outside of my canvas. Here is what it looks like:
I have center it by doing:
fig.update(layout={“title”: {“x”: 0.5}})
But when I do same things with y and any value between 0 and 1, nothing change (I am still talking about the title).
Here is the code of the fig:
fig = px.scatter_mapbox(new_df,
title = “Lorem ipsum dolor sit amet, consectetur adipiscing elit, sed do eiusmod tempor incididunt”,
lat = “latitude”,
lon = “longitude”,
zoom = 4.5,
height = 500,
[no important stuff]
)
fig.update(layout={“title”: {“x”: 0.5, “y”: 0}})
fig.update_layout(
mapbox = {‘style’: “stamen-toner”, ‘center’: {‘lon’: 2, ‘lat’ : 47}, ‘zoom’: 4.8},
showlegend = True,
legend_orientation = “h”,
margin = {‘l’ : 0, ‘r’ : 0, ‘b’ : 10, ‘t’ : 10})
Thanks and have a great weekend! 
PS: Pb 2 is more important than pb 1 
