Datetime problem when plotting with Bar chart

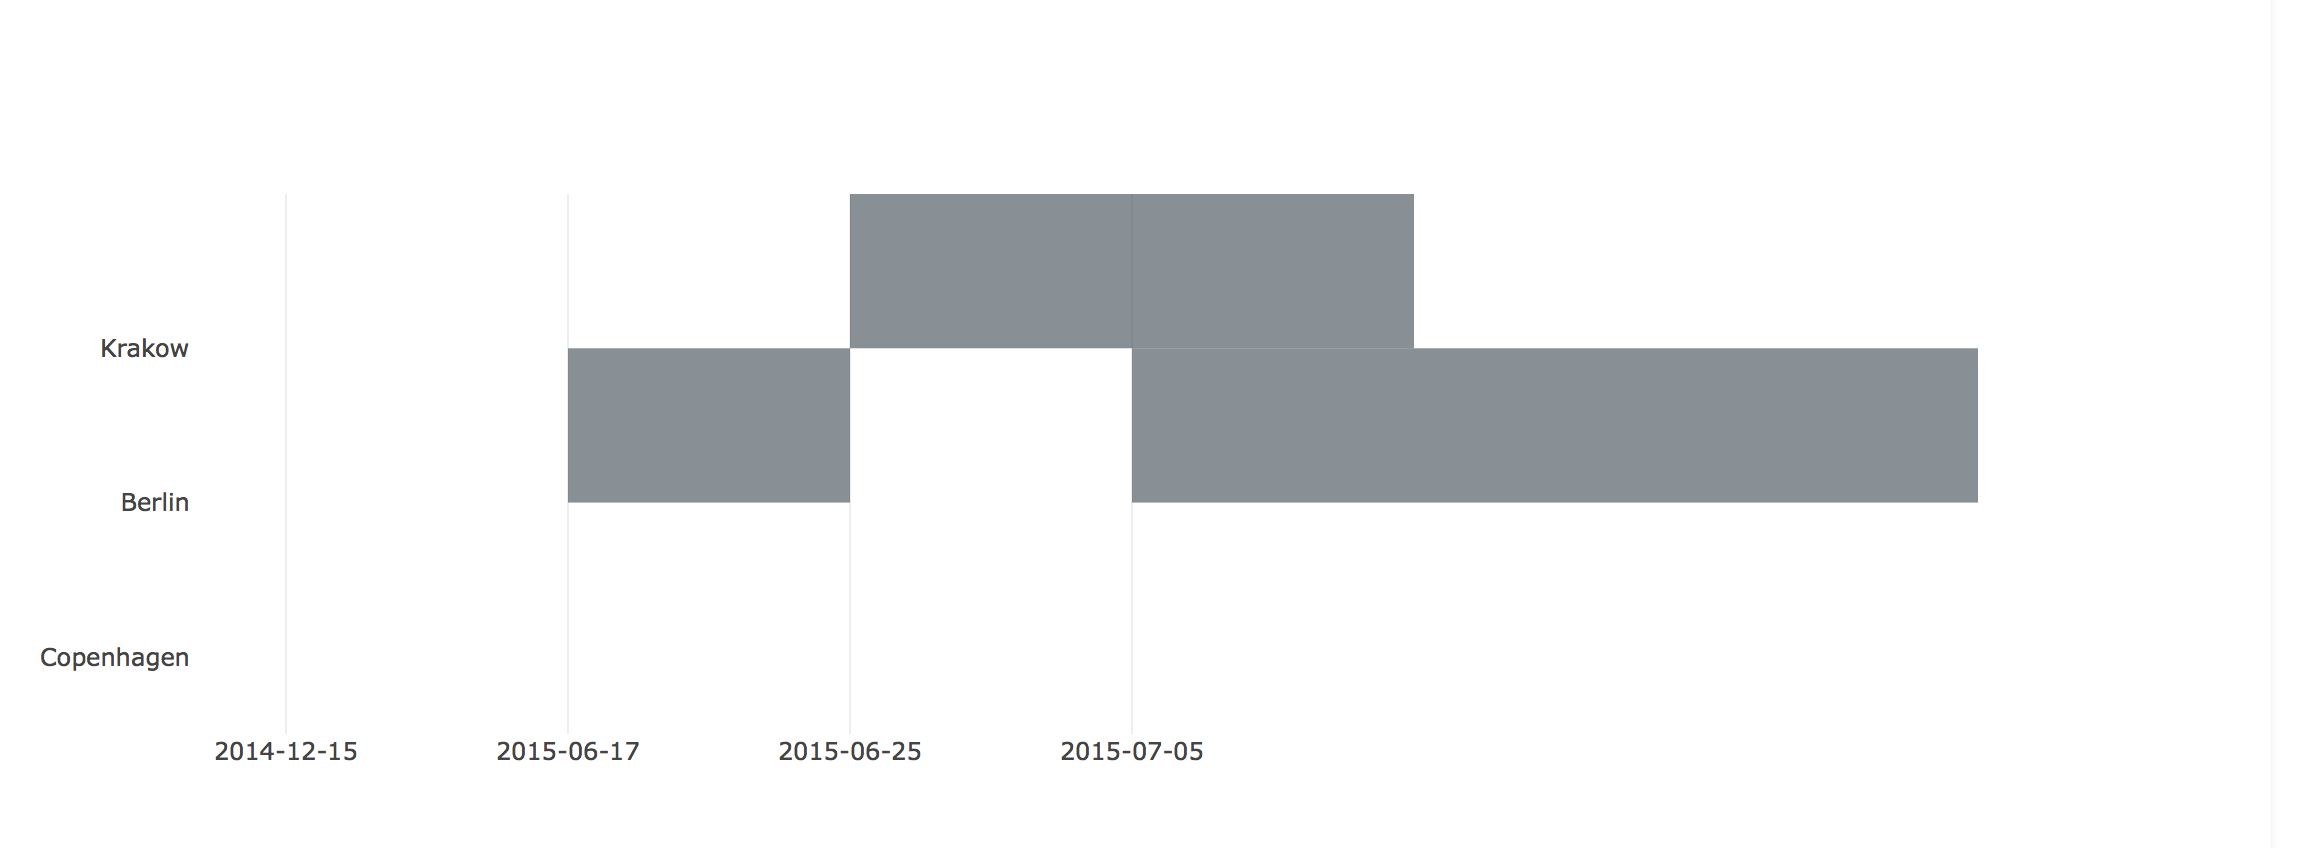
When I try to plot a panda dataframe with datetime objects with Barchart my beggining year is always 1970. When I do it with Scatter plot the year is correct. Do you have an idea why it is starting always from 1970?
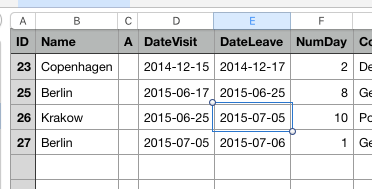
print Beginpres:
0 2015-11-12
1 2015-12-18
2 2015-12-18
3 2015-11-17
4 2016-09-15
5 2016-07-26
6 2016-07-25
7 2016-07-04
8 2016-08-26
9 2016-07-12
10 2016-09-02
11 2016-08-26
12 2016-08-30
13 2016-08-09
14 2016-10-17
15 2016-08-04
16 2016-08-04
17 2016-09-08
18 2016-10-07
19 2016-10-04
20 2016-10-11
21 2016-10-10
22 2016-09-26
23 2016-09-23
24 2016-10-05
25 2016-10-10
26 2016-09-22
27 2016-10-11
28 2015-10-03
29 2016-10-04

257 2018-01-08
258 2017-12-21
259 2018-01-08
260 2018-01-30
261 2017-12-19
262 2018-01-12
263 2018-02-01
264 2017-12-18
265 2017-12-18
266 2017-12-18
267 2017-12-18
268 2018-01-10
269 2018-01-12
270 2018-01-19
271 2018-01-24
272 2018-01-26
273 2018-01-23
274 2018-03-02
275 2018-02-06
276 2018-03-14
277 2018-03-06
278 2018-03-02
279 2018-03-02
280 2018-02-26
281 2018-04-05
282 2018-03-14
283 2018-03-14
284 2018-03-21
285 2018-04-16
286 2018-05-16
Name: beginPRE, Length: 287, dtype: object

import xml.etree.ElementTree as ET
import plotly
import plotly.graph_objs as go
from datetime import datetime
import pandas as pd
from datetime import timedelta as td
from dateutil import parser
import matplotlib.dates as mdate
import datetime

def plotting():

df = pd.read_csv('input.csv', encoding='latin-1', sep=';')
sbRefs = df['sbRef']
beginPREs = df['beginPRE']
beginAUTs = df['beginAUT']

traces = []

for i in range(1,7):

    traces.append(
        go.Bar(
            y  = [sbRefs[i]],
            x = [beginPREs[i]],
            name='PRE',
            orientation='h',
            marker=dict(
                color='blue',
                line=dict(
                    color='blue',
                    width=3)
            )
        )
    )

    traces.append(
        go.Bar(
            y= [sbRefs[i]],
            x=[beginAUTs[i]],
            name='AUT',
            orientation='h',
            marker=dict(
                color='purple',
                line=dict(
                    color='purple',
                    width=3)
            )
        )
    )
    layout = go.Layout(
        barmode='stack',
        showlegend=False,
        xaxis=dict(
            range=[(datetime.datetime(2010, 10, 17)),
                   (datetime.datetime(2020, 11, 20))]
        )
    )
    fig = go.Figure(data=traces, layout=layout)
    plotly.offline.plot(fig, filename='marker-h-bar')

plotting()

same problem here
I am trying to do a float barchart with x as date y as name and the length or duration of time is the bars
looks likes the day calcualation is wrong, even though the x calculate correctly but the bar length is not correct.

in the picture, see the length of Krakow is longer than it suppose to be

trace2 = go.Bar(
        y=visit.Name,
        x= pd.to_datetime(visit.DateLeave)-pd.to_datetime(visit.DateVisit),
        base= visit.DateVisit,
        name='date leave',
        orientation = 'h',
        offset= 0,
        width=1,
        marker = dict(
            color = 'rgba(58, 71, 80, 0.6)',
            line = dict(
                color = 'rgba(58, 71, 80, 1.0)',
                )
        )
    )

data = [trace2]
layout = go.Layout(
    barmode='relative'
)
fig = go.Figure(data=data, layout=layout)
return fig

42%20PM

After sleeples day and bight I found this.

I found this is very hrlpful

1 Like

Hey! This usually works for me but I haven’t tried it with dates.

layout= go.Layout(xaxis=dict(range=[min(X),max(X)]))

Let me know if it helps.

Hi @Teoharov and @cameron54,

If you’re still stuck on this problem, could you post a small example (inside a fenced code block so the formatting doesn’t get messed up)? It’s easier for people to understand the problem you’re facing, and offer help, if they have an example that they can copy and paste into a Jupyter Notebook cell and just run.

Thanks!
-Jon

1 Like

The code below works for me. I did not fix the problem that I had but I just change the method. the horizontal bar with x, y, and base still does not work for me but I use ‘gantt’ below to create a floating bargraps instead and it works wonderful.

import plotly.plotly as py
import plotly.figure_factory as ff
import pandas as pd


df = pd.read_csv('places2.csv')

colors = {'Not Started': 'rgb(220, 0, 0)',
          'Incomplete': (1, 0.9, 0.16),
          'Complete': 'rgb(0, 255, 100)'}

fig = ff.create_gantt(df, colors=colors, index_col='Resource', show_colorbar=True, group_tasks=True)
py.iplot(fig, filename='gantt-group-tasks-together', world_readable=True)

Great! glad you found a solution,
-Jon