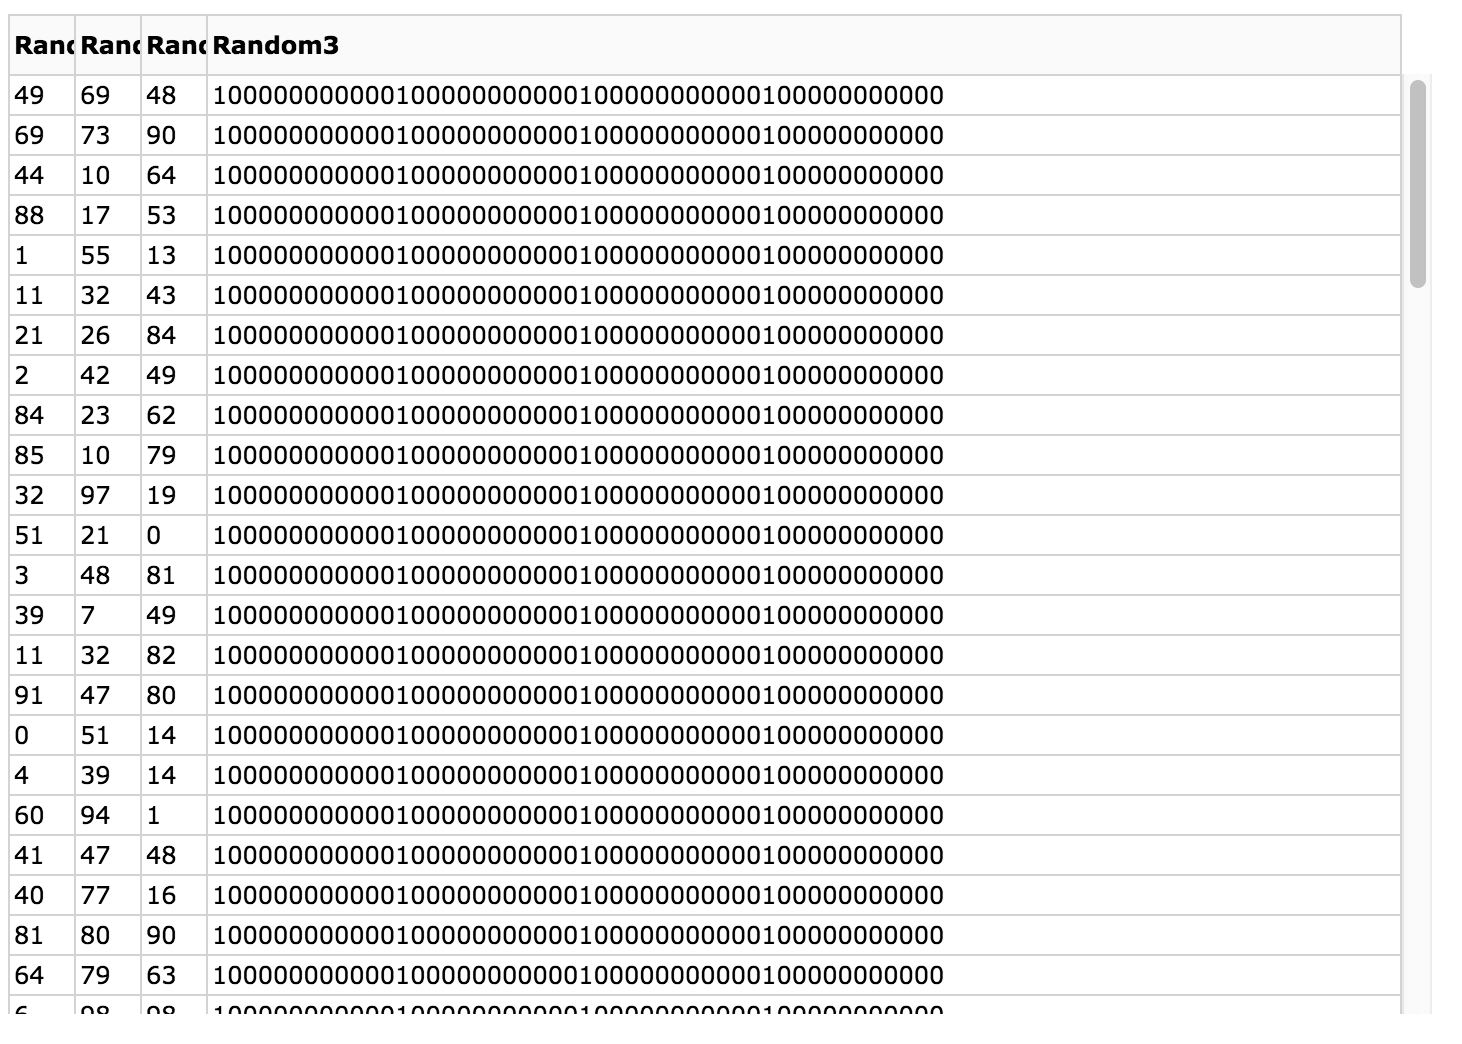
In a Dash app, I populate a Data Table whose last column usually has contents that don’t fit into its cells. Now, the problem is, no matter which settings I try, the cells refuse to overflow the way I want, which is vertically - i.e. the text being split into multiple lines - and instead just stretch the cells horizontally, leading to problems like this:

One thing I have done is try to force the cells to be the same width, but that doesn’t work,
style_cell = {'whiteSpace':'normal', 'minWidth': '25%', 'width': '25%', 'maxWidth': '25%'},
though it does help, as without the above line, my graph ends up looking even worse:
Also, following the “Multiple Lines” strategy here - https://dash.plot.ly/datatable/sizing - doesn’t work, either, by setting
style_data={'whiteSpace': 'normal', 'height': 'auto'}.
I would extremely appreciate any advice on handling this matter from anyone on this forum, and want to thank them in advance.
My MWE:
import numpy as np
import pandas as pd

import dash
import dash_core_components as dcc
import dash_html_components as html
import dash_table

app = dash.Dash(__name__)
app.scripts.config.serve_locally = True
app.config['suppress_callback_exceptions'] = True

fonts = '12px Verdana, Geneva, sans-serif'


###### Data Generation ######

## Dummy data that A) is long and necessitates scrolling, and
## B) should cause certain columns' cells to overflow somehow
columns = ["Random", "Random1", "Random2", "Random3"]

rows = [[np.random.randint(0,100,size=1)[0], np.random.randint(0,100,size=1)[0],
         np.random.randint(0,100,size=1)[0],
         [np.random.randint(100000000000,100000000001,size=1)[0], ## This part just for creating overly wide #'s
          np.random.randint(100000000000,100000000001,size=1)[0],
          np.random.randint(100000000000,100000000001,size=1)[0],
          np.random.randint(100000000000,100000000001,size=1)[0]]] for i in range(100)]

df = pd.DataFrame(columns=columns, data=rows)


###### Main code ######

app.layout = html.Div(children=[

    html.Div(children=[

            dash_table.DataTable(

                         ## Entering data from dataframe
                         data = df.to_dict('records'),
                         columns = [{'id': c, 'name': c} for c in df.columns],

                         ## Setting each cell to the same, set width
                         style_cell = {'whiteSpace':'normal',
                                       'minWidth': '25%', 'width': '25%', 'maxWidth': '25%'},

                         ## Applying vertical scrolling only - as per https://dash.plot.ly/datatable/sizing
                         fixed_rows = { 'headers': True, 'data': 0 },

                         ## Confirming above choices by setting a max height for the table,
                         ## and turning off the horizontal scrolling by setting it to 'hidden'
                         style_table={'maxHeight': '600',
                                      'overflowY': 'auto',
                                      'overflowX': 'hidden'},

                         style_data={'whiteSpace': 'normal',
                                     'height': 'auto'},

                         ## Applying some minor formatting
                         style_cell_conditional=[{'textAlign':'left',
                                                  'font': fonts}],
                         style_header={'fontWeight':'bold'},

                            ),

            html.Div(children=[
                dcc.Graph(id='Sentiment_Graph',
                          figure={'layout': {'title': 'Random Title',
                                             'barmode':'overlay'},
                                  'data': []
                                 }
                         )
                               ]
                    )

                        ],

              style={'display':'grid', 'grid-template-columns': '50% 50%', 'column-gap':'20px',
                     'margin-top':'10px'}),

])


if __name__ == '__main__':
    app.run_server(debug=True)