Hello, for some reason, my dashboard is frozen where I can’t click on anything. Here is what it looks like:
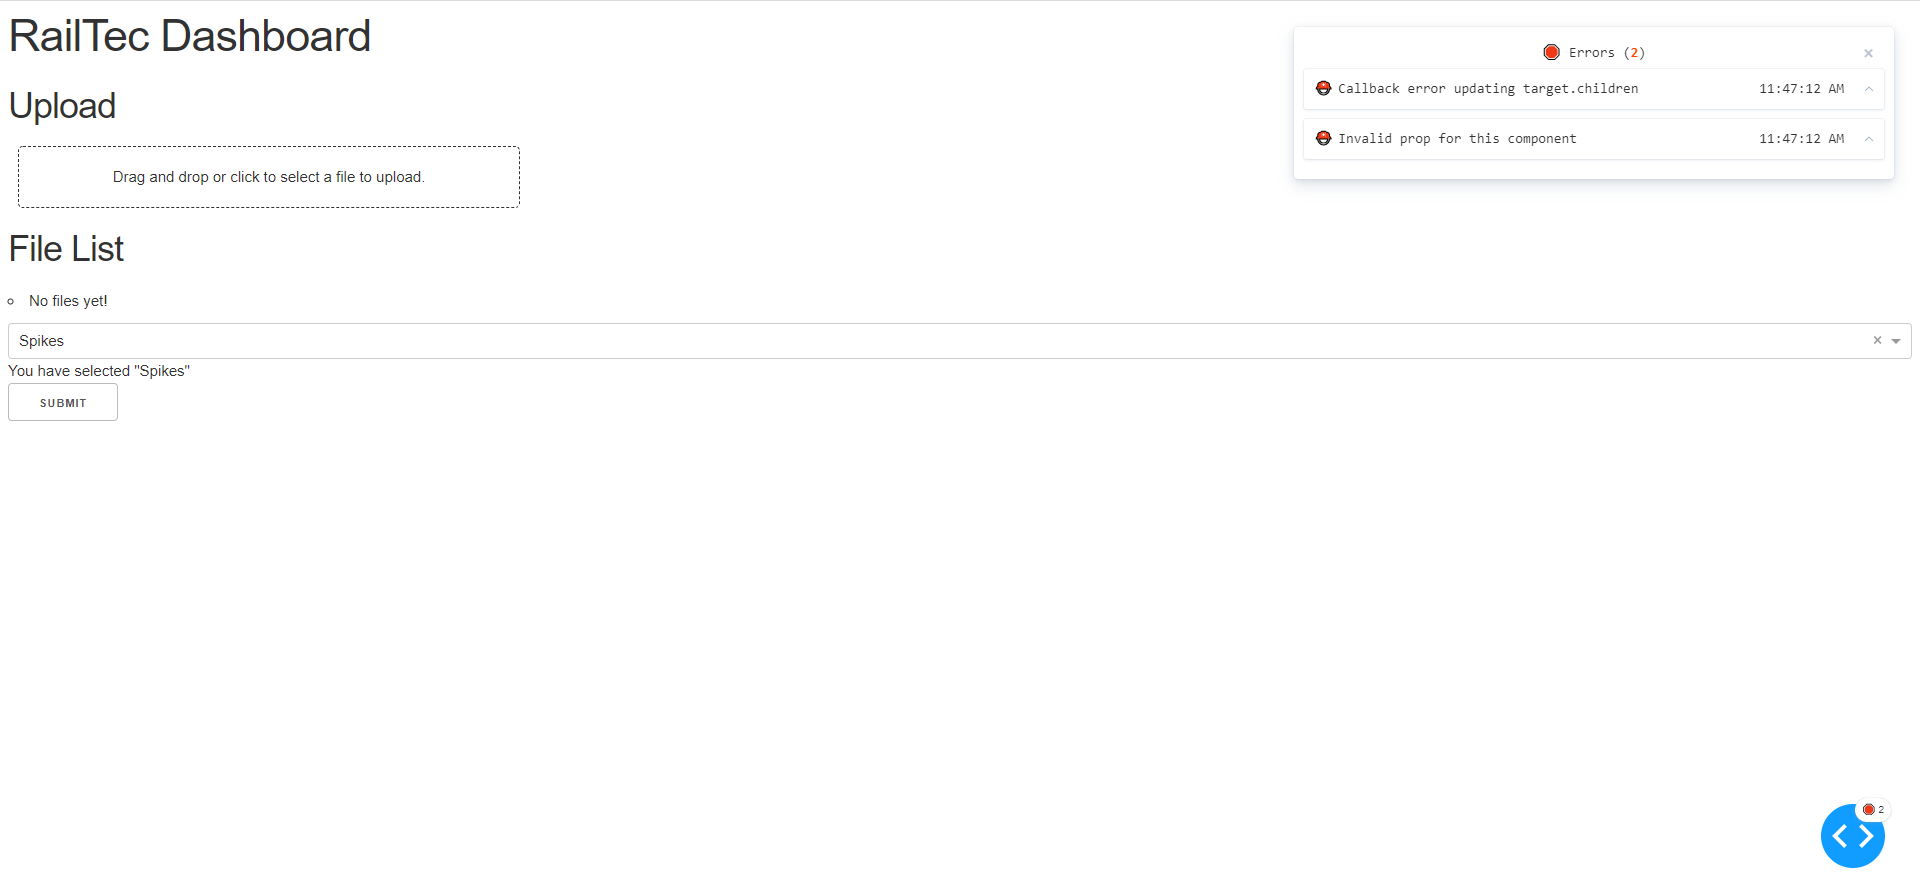
I will post the whole code for what I have. To give a short summary, I am trying to use my button app.callback function to take in the dropdown implementation as an input as well as utilizing my upload button for receiving an Excel file the user may give(They all have the same sheets but different data) to use my calculation to return a graph for that specific excel sheet and sheet the user chooses from the dropdown.
#The app layout structure of the Dashboard.

UPLOAD_DIRECTORY = "Dash_Folder"

if not os.path.exists(UPLOAD_DIRECTORY):
    os.makedirs(UPLOAD_DIRECTORY)

@server.route("/download/<path:path>")
def download(path):
    """Serve a file from the upload directory."""
    return send_from_directory(UPLOAD_DIRECTORY, path, as_attachment=True)


#Uploading file definitions
def save_file(name, content):
    """Decode and store a file uploaded with Plotly Dash."""
    data = content.encode("utf8").split(b";base64,")
    with open(os.path.join(UPLOAD_DIRECTORY, name), "wb") as fp:
        fp.write(base64.decodebytes(data))
def uploaded_files():
    """List the files in the upload directory."""
    files = []
    for filename in os.listdir(UPLOAD_DIRECTORY):
        path = os.path.join(UPLOAD_DIRECTORY, filename)
        if os.path.isfile(path):
            files.append(filename)
    return files
def file_download_link(filename):
    """Create a Plotly Dash 'A' element that downloads a file from the app."""
    location = "/download/{}".format(urlquote(filename))
    return html.A(filename, href=location)

@app.callback(
Output("file-list", "children"),
[Input("upload-data", "filename"), Input("upload-data", "contents")],)

def update_output(uploaded_filenames, uploaded_file_contents):
    """Save uploaded files and regenerate the file list."""

    if uploaded_filenames is not None and uploaded_file_contents is not None:
        for name, data in zip(uploaded_filenames, uploaded_file_contents):
            save_file(name, data)

    files = uploaded_files()
    if len(files) == 0:
        return [html.Li("No files yet!")]
    else:
        return [html.Li(file_download_link(filename)) for filename in files]

#Callback for dropdown menu
@app.callback(dash.dependencies.Output('dd-output-container', 'children'),[dash.dependencies.Input('Categories', 'value')])
def update_output_dropdown(value):
    return 'You have selected "{}"'.format(value)


def calculation():
    #Read the uploaded file and calculate the category from dropdown
        if os.path.exists(UPLOAD_DIRECTORY):
            for file in uploaded_files():
                print(file)
                dfs = pd.read_excel(file, sheet_name='None')
                # here either "value": k or "value": sheets[k], not sure how dash works internally
                options = [{"label": k, "value": k} for k in dfs]
                # Define if we analyzing Premium or Cut Spikes
                # Define if the data is reliable
                dfs.loc[(dfs['Fastener_Presence'] !='X') & (dfs['Concrete_or_Timber'] == 'Wooden'), 'Timber_Fastener_Type'] = 'Premium'
                dfs.loc[(dfs['Fastener_Presence'] =='X') & (dfs['Concrete_or_Timber'] == 'Wooden'), 'Timber_Fastener_Type'] = 'Cut Spikes'
                dfs.loc[(dfs['Spike_Presence'] =='X') & (dfs['Fastener_Presence'] == 'X'), 'Timber_Fastener_Type'] = 'Error'
                # dfs.to_excel("Test_Type.xlsx")

                # Cleaning the data
                dfs = dfs[dfs.Concrete_or_Timber != 'Concrete']
                dfs = dfs[dfs.Timber_Fastener_Type != 'Error']
                dfs = dfs.reset_index(drop=True)
                dfs['Spike_Presence'] = dfs.Spike_Presence.replace('X',0)
                dfs['Spike_Presence'] = dfs.Spike_Presence.replace('x',0)
                dfs['Fastener_Presence'] = dfs.Fastener_Presence.replace('X',0)
                dfs['Fastener_Presence'] = dfs.Fastener_Presence.replace('x',0)

                # dfs.to_excel("Test_Type.xlsx")


                # Make sure we are working with floats
                dfs['Spike_Presence'] = dfs['Spike_Presence'].astype(float)
                dfs['Fastener_Presence'] = dfs['Fastener_Presence'].astype(float)

                #Function to calculate how many fasteners in 5 ties window
                def g(column,i):
                    a = np.sum(column[i-2:i+3].to_list())
                    return a

                # Create new dataframe to receive all the calculations from function g
                dfsnew = pd.DataFrame(columns=['Spike_Presence_5_Ties','Fastener_Presence_5_Ties'])

                # Passing function in the dataframe
                for j in range(0, len(dfs)):
                    Spike_Presence_5_Ties = g(dfs['Spike_Presence'], i=j)
                    Fastener_Presence_5_Ties = g(dfs['Fastener_Presence'], i=j)

                    dfsnew = dfsnew.append({'Spike_Presence_5_Ties':Spike_Presence_5_Ties,
                                            'Fastener_Presence_5_Ties': Fastener_Presence_5_Ties
                                            }, ignore_index=True, verify_integrity=False, sort=False)

                # dfsnew.to_excel("Test.xlsx")
                dfs1 = pd.concat([dfs, dfsnew], axis=1)
                # Rename dataframe dfs1
                dfspike = dfs1

                # Define rules. Data x means percentage to consider a bad spot. Data y means the value from 0 to 1 for each one of the percentages
                # Cut Spikes Rules
                datax = [0,5,10,15,20,25,30,35,38,40]
                datay = [1,1,1,1,0.8,0.6,0.4,0.2,0.1,0]
                # Define rules. Data x means percentage to consider a bad spot. Data y means the value from 0 to 1 for each one of the percentages
                # Premium Rules
                datax1 = [0,2,4,6,8,10,12,14,16,18,20]
                datay1 = [1,1,1,0.8,0.6,0.5,0.4,0.35,0.3,0,0]
                x1 = np.array(datax1)
                y1=np.array(datay1)
                z1 = np.polyfit(x1,y1,2)
                print ('{0}x^2 + {1}x + {2}'.format(*z1))
                x = np.array(datax)
                y=np.array(datay)
                z = np.polyfit(x,y,2)
                print ('{0}x^2 + {1}x + {2}'.format(*z))

                def print_graph_cut_spikes(S):
                    # Plotting the degradation function - Cut Spikes
                    S = lambda x: z[0]*x**2 + z[1]*x + z[2]
                    xs = np.linspace(0,40,240)
                    ys = S(xs)
                    #fig = plt.figure(figsize=(20,12))
                    fig4 = px.line(x = xs, y = ys, title= 'Cut Spikes Degradation Function')
                    return fig4


                def print_graph_premium_spikes(S1):
                    # Plotting the degradation function - Premium E-Clips
                    S1 = lambda x: z1[0]*x**2 + z1[1]*x + z1[2]

                    xs = np.linspace(0,20,240)
                    ys = S1(xs)

                    fig5 = px.line(x = xs, y = ys, title= 'Cut Spikes Degradation Function')
                    return fig5


                def FSpikes(x):

                    res = z[0]*(x)**2 + z[1]*(x) + z[2]

                    if res<0:
                        res=0
                    else:
                        res = res
                    if res>1:
                        res=1

                    return res

                def FPremium (s,c):   # s = number of spikes, c = number of e-clips

                    res_s = z[0]*(s)**2 + z[1]*(s) + z[2]
                    res_c = z1[0]*(c)**2 + z1[1]*(c) + z1[2]

                    resf = 0.4*res_s + 0.6*res_c #Spikes represent 40% of the strenght and e-clips 60%

                    if resf<0:
                        resf=0
                    else:
                        resf = resf
                    if resf>1:
                        resf=1

                    return resf


                dfspike['Health'] = dfspike.apply(lambda row : FSpikes(row['Spike_Presence_5_Ties']) if row['Timber_Fastener_Type'] == 'Cut Spikes' else FPremium(row['Spike_Presence_5_Ties'],row['Fastener_Presence_5_Ties'] ) , result_type='expand', axis=1)
                dfspike = dfspike.reset_index(drop=True)


                DF1 = dfspike.drop(['Spike_Presence','Fastener_Presence','Timber_Fastener_Type','Spike_Presence_5_Ties','Fastener_Presence_5_Ties'], axis=1)

                df2 = pd.read_excel (r'TQI_Data.xlsx', sheet_name='Fasteners')

                # Cleaning the data
                df2 = df2[df2.Concrete_or_Timber != 'Wooden']
                df2 = df2.reset_index(drop=True)
                df2['Fastener_Presence_Correct'] = df2.Fastener_Presence.replace('X',4)

                #Function to calculate how many fasteners in 5 ties window
                def f(column,i):
                    a = np.sum(column[i-2:i+3].to_list())
                    return a
                # Create new dataframe to receive results from funtion f
                df2new = pd.DataFrame(columns=['Fastener_Presence_5_Ties'])
                df2['Fastener_Presence_Correct'] = df2['Fastener_Presence_Correct'].astype(float)

                # Passing function in the dataframe
                for j in range(0, len(df2)):
                    Fastener_Presence_5_Ties = f(df2['Fastener_Presence_Correct'], i=j)

                    df2new = df2new.append({'Fastener_Presence_5_Ties':Fastener_Presence_5_Ties
                                            }, ignore_index=True, verify_integrity=False, sort=False)
                # Concatanate the two dataframes
                df2 = pd.concat([df2, df2new], axis=1)

                # Define rules. Data x means percentage to consider a bad spot. Data y means the value from 0 to 1 for each one of the percentages
                # Concrete Ties
                datax2 = [0,2,4,6,8,10,12,14,16,18,20]
                datay2 = [1,1,1,0.6,0.4,0.35,0.3,0.25,0.1,0,0]


                x2 = np.array(datax2)
                y2=np.array(datay2)
                z2 = np.polyfit(x2,y2,2)

                print ('{0}x^2 + {1}x + {2}'.format(*z2))

                def concrete_graph(H):
                    # Plotting the degradation function
                    H = lambda x: z2[0]*x**2 + z2[1]*x + z2[2]

                    xs = np.linspace(0,20,10)
                    ys = H(xs)
                    fig6 = px.line(x = xs, y = ys, title= 'Concrete Ties')
                    return fig6


                #Defining the function that pass the measured value, divide it by the design height (resulting the porcentage) and return the track health based on the created rule
                def FConcrete(x):

                    resconc = z2[0]*(x)**2 + z2[1]*(x) + z2[2]

                    if resconc<0:
                        resconc=0
                    if resconc>1:
                        resconc=1
                    else:
                        resconc = resconc

                    return resconc

                # Calculate Health Index for Concrete
                df2['Health'] = df2.apply(lambda row : FConcrete(row['Fastener_Presence_5_Ties']), result_type='expand', axis=1)
                DF2 = df2.drop(['Fastener_Presence','Fastener_Presence_Correct','Fastener_Presence_5_Ties'], axis=1)
                DF2

                # Merge DF1 and DF2.
                # This will result the totality of the loop Fasteners Health Index.
                DF = pd.concat([DF1, DF2],axis=0)
                DF = DF.sort_values(by=['Stationing'],axis=0)
                DF = DF.reset_index(drop=True)

                # Gambiarra do carai pra n corrigir entre stationings 3810.368 e 4525.509
                df_gambiarra = pd.DataFrame({'Stationing':[4525],'Concrete_or_Timber':['Wooden'],'Health':[0]})
                DF = pd.concat([DF, df_gambiarra],axis=0)
                DF = DF.sort_values(by=['Stationing'],axis=0)
                DF = DF.reset_index(drop=True)
                print(DF)
                #DF.to_excel("Test.xlsx")

                def Health_Graph(DF):
                    ax_DF = px.line(DF, x = 'Stationing', y = 'Health', title= 'Fastener Health Index')
                    return ax_DF
                Health_Graph(DF)

#Callback for submitting everything.
@app.callback(Output('target', 'children'), Input('submit', 'n_clicks'), Input('Categories', 'value: (sheet_name, df)'), State('Categories', 'value'))
def callback(n_clicks):
    if (n_clicks != 0):
        calculation()


#To route graph calculation output in another page
#@app.server.route('/post', methods=['POST'])
#def on_post():
    #data = flask.request.form
    #print(data)
    #return flask.redirect('/')

app.layout = html.Div(
    children=[
    html.H1(children='RailTec Dashboard'),
    #Uploading the files to the board. We want to make sure that two files can be uploaded, read, and grab the same categories to the direct coorelated category.
    #For choosing files between tabs
    html.Div(
    [
        html.H2("Upload"),
        dcc.Upload(
            id="upload-data",
            children=html.Div(
                ["Drag and drop or click to select a file to upload."]
            ),
            style={
                "width": "100%",
                "height": "60px",
                "lineHeight": "60px",
                "borderWidth": "1px",
                "borderStyle": "dashed",
                "borderRadius": "5px",
                "textAlign": "center",
                "margin": "10px",
            },
            multiple=True,
        ),
        html.H2("File List"),
        html.Ul(id="file-list"),
    ],
    style={"max-width": "500px"},
    ),
    #Drop Down Menu for the categories.
    dcc.Dropdown(
        id = 'Categories',
        options=[
            {'label': 'Spikes', 'value': 'Spikes'},
            {'label': 'Fasteners', 'value': 'Fasteners'},
            {'label': 'Ballast Level', 'value': 'Ballast Level'},
            {'label': 'Spikes Med', 'value': 'Spikes'},
            {'label': 'Fasteners Med', 'value': 'Fasteners'},
            {'label': 'Ballast Level Med', 'value': 'Ballast Level'},
            {'label': 'Spikes Bad', 'value': 'Spikes'},
            {'label': 'Fasteners Bad', 'value': 'Fasteners'},
            {'label': 'Ballast Level Bad', 'value': 'Ballast Level'}
        ],
        placeholder="Select a category",
        value = "Spikes"
    ),
    html.Div(id='dd-output-container', children = []),

    html.Form([
    #Enter button Event to trigger app callback for dropdown and upload data to submit what to calculate.
    html.Div(id='target'),
    html.Button('Submit',id='submit', n_clicks=0),
    ]),

    dcc.Graph(
    id='Concrete_Health_method',
    figure= calculation(),
    #calculator_1.graph_concrete(df2)
    style ={'display': 'inline-block'})
    ])
if __name__ == '__main__':
    app.run_server(debug=True)