Dash_table upgrade issue

Hello everyone,

I have been loving dash and using it for a while now. Recently, I had to re-install the packages and thus dash updated. After that, I have been experiencing an error for the data table. I am basically updating the data table depending on the selection of a dropdown menu. Here is the part that gets triggered when the drowdown selection changes:

@app.callback([Output('datatable', 'data'),
               Output('datatable', 'columns')],
              [Input('user_selection', 'value')])
def update_output(value):
    user_found = False
    for user in all_users:
        if user.id == value:
            selectedUserIndex = all_users.index(user)
            user_found = True
            break

    if user_found:
        selected_user = all_users[selectedUserIndex]
        all_sessions_df = pd.DataFrame.from_records([s.to_dict() for s in selected_user.allSessions])
        return all_sessions_df.to_dict('records'), [{"name": j, "id": j} for j in all_sessions_df.columns]
    else:
        return [], []

Before the upgrade, everything was working fine. Now, I am getting the following error:

Invalid argument columns[0] passed into DataTable with ID “datatable”.
Expected object.
Was supplied type string.

when I load the page.

Any help will be highly appreciated.
Thanks,
Daniyal

Hi @daniyal134 not possible to execute your code here since it’s not standalone, but I can try to guess. Could you print in the callback the arguments which are getting returned to know exactly which one is triggering the error? It’s possible that it’s the empty list of the last line which is causing the problem but it’s hard to know.

Also you may want to be sure that you don’t have incompatibility problems between versions of the packages (datatable is now installed with dash), so to be sure you could uninstall dash and datatable and then reinstall just dash (which will reinstall datatable along the way).

Hello Emmanuelle,

I am very greatful for your response. I will try to explain the code in more detail but I want to highlight everything with the exact same code was working perfectly before the re-install.

Also while installing, I did not install dash table separately but I will follow your advice and uninstall-reinstall.

I will post soon with printing the arguments.

So, the way this works is that initially, when the webapp is loaded, it gives me the error.

Then, when I make a valid selection, a graph appears with no data. I also have a line graph. And the table does not appear at all. This is the print of what the callbacks are returned:

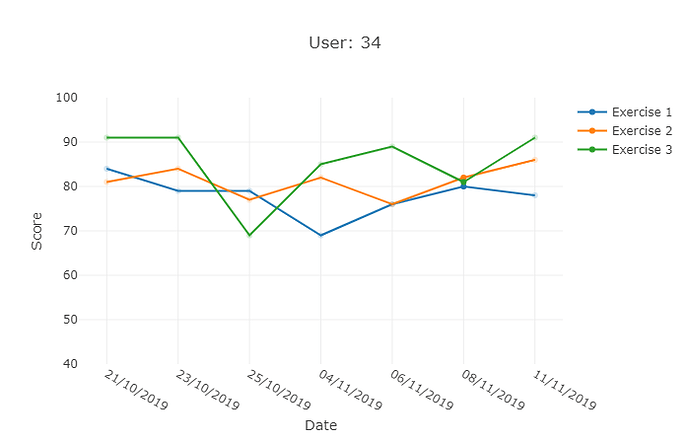
[{'Date': '21/10/2019', 'Time': '14:03', 'Device': 'WEMO022', 'Answer 1': '🙂', 'Answer 2': '🙂', 'Exercise 1': '84%', 'Exercise 2': '81%', 'Exercise 3': '91%'}, {'Date': '23/10/2019', 'Time': '14:06', 'Device': 'WEMO022', 'Answer 1': '🙂', 'Answer 2': '🙂', 'Exercise 1': '79%', 'Exercise 2': '84%', 'Exercise 3': '91%'}, {'Date': '25/10/2019', 'Time': '14:05', 'Device': 'WEMO022', 'Answer 1': '🙂', 'Answer 2': '🙂', 'Exercise 1': '79%', 'Exercise 2': '77%', 'Exercise 3': '69%'}, {'Date': '04/11/2019', 'Time': '14:03', 'Device': 'WEMO022', 'Answer 1': '🙂', 'Answer 2': '🙂', 'Exercise 1': '69%', 'Exercise 2': '82%', 'Exercise 3': '85%'}, {'Date': '06/11/2019', 'Time': '14:03', 'Device': 'WEMO022', 'Answer 1': '🙂', 'Answer 2': '🙂', 'Exercise 1': '76%', 'Exercise 2': '76%', 'Exercise 3': '89%'}, {'Date': '08/11/2019', 'Time': '14:02', 'Device': 'WEMO022', 'Answer 1': '🙂', 'Answer 2': '🙂', 'Exercise 1': '80%', 'Exercise 2': '82%', 'Exercise 3': '81%'}, {'Date': '11/11/2019', 'Time': '14:10', 'Device': 'WEMO022', 'Answer 1': '🙂', 'Answer 2': '🙂', 'Exercise 1': '78%', 'Exercise 2': '86%', 'Exercise 3': '91%'}]

[{'name': 'Date', 'id': 'Date'}, {'name': 'Time', 'id': 'Time'}, {'name': 'Device', 'id': 'Device'}, {'name': 'Answer 1', 'id': 'Answer 1'}, {'name': 'Answer 2', 'id': 'Answer 2'}, {'name': 'Exercise 1', 'id': 'Exercise 1'}, {'name': 'Exercise 2', 'id': 'Exercise 2'}, {'name': 'Exercise 3', 'id': 'Exercise 3'}]

I have just realised that this might also be an issue related to the instantiation of the table. Here is how I am doing it:

        html.Div(style={'marginRight': 50, 'marginLeft': 50}, children=[
            html.Div(style={'marginTop': 20, 'marginBottom': 20},
                     id='selection_string'
                     ),
            dt.DataTable(
                columns=["Number", "Q1", "Q2", "Timestamp", "Device"],
                style_cell={'textAlign': 'left'},
                style_as_list_view=True,
                style_header={
                    'backgroundColor': 'rgb(230, 230, 230)',
                    'fontWeight': 'bold',
                    'fontSize': 12
                },
                id='datatable'
            )
        ]),

As soon as I posted this, I realised that this was the problem since all these are strings and the error states that strings were passed. Removed this line and no error on start up and the table works fine!

On the other hand, I have a graph on the page as well. This is how the graph is generated:

html.Div(id='cmc_plot_container',
                 style={'marginRight': 50, 'marginLeft': 50, 'marginTop': 50, 'marginBottom': 50,
                        'backgroundColor': colors['background']}, children=[
                dcc.Graph(
                    id='cmc_plot',
                    figure={'layout': {
                        'title': 'User: ',
                        'bgcolor': colors['background'],
                        'yaxis': {
                            'title': 'Score',
                            'range': [40, 100]
                        },
                        'xaxis': {
                            'title': 'Date',
                        }
                    }
                    }
                )]),

And this is the callback to update the graph on user selection:

@app.callback(
    dash.dependencies.Output('cmc_plot', 'figure'),
    [dash.dependencies.Input('user_selection', 'value')])
def update_cmc_plot(value):
    user_found = False
    for user in all_users:
        if user.id == value:
            selectedUserIndex = all_users.index(user)
            user_found = True
            break

    if user_found:
        selected_user = all_users[selectedUserIndex]
        all_sessions_df = pd.DataFrame.from_records([s.to_dict_cmc_graph() for s in selected_user.allSessions])
        cmc_dict = all_sessions_df.to_dict('records')

        print([d['Date'] for d in cmc_dict])
        print([e2['Exercise 2'] for e2 in cmc_dict])
        return {

            'data': [
                {
                    'type': 'scatter',
                    'name': 'Exercise 1',
                    'x': [d['Date'] for d in cmc_dict],
                    'y': [e1['Exercise 1'] for e1 in cmc_dict]
                },
                {
                    'type': 'scatter',
                    'name': 'Exercise 2',
                    'x': [d['Date'] for d in cmc_dict],
                    'y': [e2['Exercise 2'] for e2 in cmc_dict]
                },
                {
                    'type': 'scatter',
                    'name': 'Exercise 3',
                    'x': [d['Date'] for d in cmc_dict],
                    'y': [e3['Exercise 3'] for e3 in cmc_dict]
                }
            ],
            'layout': {
                'title': 'User: ' + str(value),
                'bgcolor': colors['background'],
                'yaxis': {
                    'title': 'Score',
                    'range': [40, 100]
                },
                'xaxis': {
                    'title': 'Date',
                }
            }
        }
    else:
        return {}

Now, the issue is that I am not seeing the graph. It seems like it is smashed into a small area. Please see image attached (Image1):

While on the other hand, if I download the graph as a png (an option on the graph), the png
is completely fine (Image 2 and hence I believe this is some problem on the rendering of the graph:

Would highly appreciate any help!

Update, a work around to the issue:

Fix the height parameter of layout to a certain value (I chose 700 px).

In the earlier version of Dash/Dashtable this was not the case, it was all dynamic. Is there something wrong I did or is it a work in progress on the developmental side?