Dash table formatting decimal place

Hi I used the last example from Typing and User Input Processing | Dash for Python Documentation | Plotly
to try format my dash data table to 3.d.p. However when I run my code the formatting seems to have no impact on the datatable. Any advice would be appreciated.

This is the datasheet I have been using

Thanks!

import base64
import io
from flask import Flask
import dash
from dash.dependencies import Input, Output, State
import dash_core_components as dcc
import dash_html_components as html
import dash_table
from dash_table.Format import Format, Scheme
import pandas as pd
import plotly.graph_objs as go

external_stylesheets = ['https://codepen.io/chriddyp/pen/bWLwgP.css']
server = Flask(__name__)
app = dash.Dash(external_stylesheets=external_stylesheets, server=server)

SUP = str.maketrans("0123456789", "⁰¹²³⁴⁵⁶⁷⁸⁹")

app.layout = html.Div([ dcc.Upload(
            id='data-table-upload',
            children=html.Div([html.Button('Upload File')],
                              style={'width': '49%', 'height': "60px", 'borderWidth': '1px',
                                     'borderRadius': '5px',
                                     'textAlign': 'center',

                                     }),
            multiple=False
        ),html.Div([html.Div([dash_table.DataTable(id='data-table-interact',
                                                                       editable=True,
                                                                       # doesnt do anything fix
                                                                       columns=[dict(type='numeric',
                                                                                    format=Format(precision=3,
                                                                                                  scheme=Scheme.fixed))],
                                                                       filter_action='native',
                                                                       sort_action='native',
                                                                       sort_mode='multi',
                                                                       selected_columns=[],
                                                                       selected_rows=[],
                                                                       page_action='native',
                                                                       column_selectable='single',
                                                                       page_current=0,
                                                                       page_size=20,
                                                                       style_data={'height': 'auto'},
                                                                       style_table={'overflowX': 'scroll',
                                                                                    'maxHeight': '300px',
                                                                                    'overflowY': 'scroll'},
                                                                       style_cell={
                                                                           'minWidth': '0px', 'maxWidth': '220px',
                                                                           'whiteSpace': 'normal',
                                                                       }
                                                                       ),
                                                  html.Div(id='data-table-container'), ], style={'padding': 15}),

                                        html.Div([html.Div([
                                            html.Label(["Select X variable:",
                                                        (dcc.Dropdown(id='xaxis', placeholder="Select an option for X",
                                                                      multi=False))
                                                        ], className="six columns",
                                                       style={'fontSize': 14, 'font-family': 'Arial',
                                                              'width': '20%', 'display': 'inline-block', 'padding': 5
                                                              })
                                        ]),
                                            html.Div([
                                                html.Label(["Select Y variable:",
                                                            (dcc.Dropdown(id='yaxis',
                                                                          placeholder="Select an option for Y",
                                                                          multi=False))
                                                            ], className="six columns",
                                                           style={'fontSize': 14, 'font-family': 'Arial',
                                                                  'width': '20%',
                                                                  'display': 'inline-block', 'padding': 5
                                                                  })
                                            ]),
                                            html.Div([
                                                html.Label(["Select size variable:",
                                                            (dcc.Dropdown(id='saxis',
                                                                          placeholder="Select an option for size",
                                                                          multi=False))],
                                                           className="six columns",
                                                           style={'fontSize': 14, 'font-family': 'Arial',
                                                                  'width': '20%',
                                                                  'display': 'inline-block', 'padding': 5}
                                                           )
                                            ]),
                                            html.Div([
                                                html.Label(["Select color variable:",
                                                            (dcc.Dropdown(id='caxis',
                                                                          placeholder="Select an option for color",
                                                                          multi=False))
                                                            ], className="six columns",
                                                           style={'fontSize': 14, 'font-family': 'Arial',
                                                                  'width': '20%',
                                                                  'display': 'inline-block', 'padding': 5
                                                                  })
                                            ]),
                                        ],
                                            style={'padding-left': '15%', 'padding-right': '5%'}
                                        ),
                                        html.Div([html.Label(["Select X axis scale:",
                                                              dcc.RadioItems(
                                                                  id='xaxis-type',
                                                                  options=[{'label': i, 'value': i} for i in
                                                                           ['Linear', 'Log']],
                                                                  value='Linear',
                                                                  labelStyle={'display': 'inline-block'}
                                                              )]),
                                                  ], style={'display': 'inline-block', 'width': '33%'}),
                                        html.Div([html.Label(["Select Y axis scale:",
                                                              dcc.RadioItems(
                                                                  id='yaxis-type',
                                                                  options=[{'label': i, 'value': i} for i in
                                                                           ['Linear', 'Log']],
                                                                  value='Linear',
                                                                  labelStyle={'display': 'inline-block'}
                                                              )]),
                                                  ], style={'display': 'inline-block', 'width': '33%'}),
                                        html.Div([html.Label(["Select color scale:",
                                                              dcc.RadioItems(
                                                                  id='colorscale',
                                                                  options=[{'label': i, 'value': i} for i in
                                                                           ['Viridis', 'Plasma']],
                                                              )])
                                                  ], style={'display': 'inline-block', 'width': '33%', 'padding': 5}),
                                        app.css.append_css({
                                            'external_url': 'https://codepen.io/chriddyp/pen/bWLwgP.css'
                                        })
                                        ], style={'backgroundColor': '#ffffff'})
    ])


def parse_contents(contents, filename):
    content_type, content_string = contents.split(',')
    decoded = base64.b64decode(content_string)
    try:
        if 'csv' in filename:
            # Assume that the user uploaded a CSV file
            df = pd.read_csv(io.StringIO(decoded.decode('utf-8')))
        elif 'xls' in filename:
            # Assume that the user uploaded an excel file
            df = pd.read_excel(io.BytesIO(decoded))
        elif 'txt' or 'tsv' in filename:
            df = pd.read_csv(io.StringIO(decoded.decode('utf-8')), delimiter=r'\s+'
                             )
    except Exception as e:
        print(e)
        return html.Div([
            'There was an error processing this file.'
        ])
    return df


# POPULATE X AXIS DROPDOWN SCATTER
@app.callback(Output('xaxis', 'options'),
              [Input('data-table-upload', 'contents')],
              [State('data-table-upload', 'filename')])
def populate_xaxis_dropdown(contents, filename):
    df = parse_contents(contents, filename)
    return [{'label': i, 'value': i} for i in df.columns]


# POPULATE Y AXIS DROPDOWN SCATTER
@app.callback(Output('yaxis', 'options'),
              [Input('data-table-upload', 'contents')],
              [State('data-table-upload', 'filename')])
def populate_yaxis_dropdown(contents, filename):
    df = parse_contents(contents, filename)
    return [{'label': i, 'value': i} for i in df.columns]


# POPULATE C AXIS DROPDOWN SCATTER
@app.callback(Output('caxis', 'options'),
              [Input('data-table-upload', 'contents')],
              [State('data-table-upload', 'filename')])
def populate_caxis_dropdown(contents, filename):
    df = parse_contents(contents, filename)
    return [{'label': i, 'value': i} for i in df.columns]


# POPULATE S AXIS DROPDOWN SCATTER
@app.callback(Output('saxis', 'options'),
              [Input('data-table-upload', 'contents')],
              [State('data-table-upload', 'filename')])
def populate_saxis_dropdown(contents, filename):
    df = parse_contents(contents, filename)
    return [{'label': i, 'value': i} for i in df.columns]


@app.callback([Output('data-table-interact', 'data'),
               Output('data-table-interact', 'columns')],
              [Input('data-table-upload', 'contents')],
              [State('data-table-upload', 'filename')])
def update_output(contents, filename):
    if contents is None:
        return [{}], []
    df = parse_contents(contents, filename)
    data = df.to_dict('records')
    columns = [{"name": i, "id": i, "deletable": True, "selectable": True} for i in df.columns]
    return data, columns


@app.callback(Output('data-table-container', 'children'),
              [Input('data-table-interact', 'data'),
               Input('data-table-interact', 'derived_virtual_data'),
               Input('data-table-interact', 'derived_virtual_selected_rows'),
               Input('xaxis', 'value'),
               Input('yaxis', 'value'),
               Input('caxis', 'value'),
               Input('saxis', 'value'),
               Input('xaxis-type', 'value'),
               Input('yaxis-type', 'value'),
               Input('colorscale', 'value')
               ])
def update_figure(rows, derived_virtual_data, derived_virtual_selected_rows, xaxis_name, yaxis_name,
                  marker_color, marker_size, xaxis_type, yaxis_type, colorscale):
    df = pd.DataFrame(rows)
    if derived_virtual_selected_rows is None:
        return []
    dff = df if derived_virtual_data is None else pd.DataFrame(derived_virtual_data)
    return [
        html.Div([dcc.Graph(id='HTS-graph',
                            figure={'data': [
                                go.Scatter(x=dff[xaxis_name], y=dff[yaxis_name],
                                           mode='markers',
                                           marker_color=dff[marker_color],
                                           marker_size=dff[marker_size],
                                           marker=dict(sizemode='area', sizeref=max(dff[marker_size]) / (15 ** 2),
                                                       sizemin=4,
                                                       opacity=0.7, showscale=True,
                                                       line=dict(width=0.7, color='DarkSlateGrey'),
                                                       colorbar=dict(title=dict(text=marker_color.translate(SUP),
                                                                                font=dict(family='Helvetica'),
                                                                                side='right')),
                                                       colorscale="Viridis" if colorscale == 'Viridis' else "Plasma"),
                                           text=dff[df.columns[0]],
                                           hoverinfo=['x', 'y', 'text', 'name'],
                                           # hovertemplate=
                                           # "<b>%{text}</b><br><br>" +
                                           # "%{yaxis_name}: %{y:.0f}<br>" +
                                           # "X Variable: %{x:. }<br>"
                                           # "S Variable : %{marker.size:. }<br>" +
                                           # "C Variable: %{marker.color:.}"
                                           # "<extra></extra>",
                                           )],
                                'layout': go.Layout(
                                    font={'family': 'Helvetica', 'size': 14},
                                    xaxis={'title': xaxis_name.translate(SUP), 'autorange': True,
                                           'mirror': True,
                                           'ticks': 'outside',
                                           'showline': True,
                                           'showspikes': True,
                                           'type': 'linear' if xaxis_type == 'Linear' else 'log'
                                           },
                                    yaxis={'title': yaxis_name.translate(SUP), 'autorange': True,
                                           'mirror': True,
                                           'ticks': 'outside',
                                           'showline': True,
                                           'showspikes': True,
                                           'type': 'linear' if yaxis_type == 'Linear' else 'log'
                                           },
                                    title="",
                                    template="simple_white",
                                    margin={'l': 50, 'b': 60, 't': 70, 'r': 50},
                                    hovermode='closest',
                                ),

                            },
                            )
                  ], style={'textAlign': 'center', 'padding': 25, 'width': '50%', 'height': '100%',
                            'horizontal-align': 'middle',
                            'padding-left': '25%', 'padding-right': '25%'
                            })
        for column in [xaxis_name] if column in dff
        for column in [yaxis_name] if column in dff
        for column in [marker_color] if column in dff
        for column in [marker_size] if column in dff
    ]


if __name__ == '__main__':
    app.run_server()
1 Like

Hello!

I’m also experiencing something similar. I’ve tried everything but I wasn’t able to get numbers like “3.124,87”. Instead, I can only get “3124,87”. Have you figure out what happened and how to overcome?

Thanks!

Hi @ffernandes_BR

This should work - I have this in one of my apps. Just delete the last two formatting lines if you don’t want the Euro symbol. I included that just in case anyone else wanted the example.

    columns=[{            
            'id': 'euros',
            'name': 'euros',
            'type': 'numeric',
            'format': Format(
                scheme=Scheme.fixed, 
                precision=2,
                group=Group.yes,
                groups=3,
                group_delimiter='.',
                decimal_delimiter=',',
                symbol=Symbol.yes, 
                symbol_prefix=u'€')},
        ]

And also be sure to include:

from dash_table.Format import Format, Group, Scheme, Symbol

I’m sure @ msuths1 has found an answer to the OP, but I’m guessing that the callback also needed to include the formatting. (but I didn’t test this)

I hope this helps!

2 Likes

It worked!!!

Many thanks @AnnMarieW!!!

:clap: :grinning: Glad it worked - Thanks for letting me know.

@AnnMarieW Where’s the documentation for Format(…)?

hi @maulberto3

There are some good examples here: https://dash.plotly.com/datatable/typing. Plus more info here https://dash.plotly.com/datatable/reference

However, I didn’t really get how to use all the features until I checked out the code: https://github.com/plotly/dash-table/tree/dev/dash_table. It turns out that Format is a pretty helpful helper object!

I made a bunch of notes and a small app to test out some of the features. In case anyone might find that useful, I’ll tidy it up and put it in Github and post a link back here when it’s ready.

I finally got back to making the app I mentioned in my previous post. You can check it out here:
https://formatTable.pythonanywhere.com

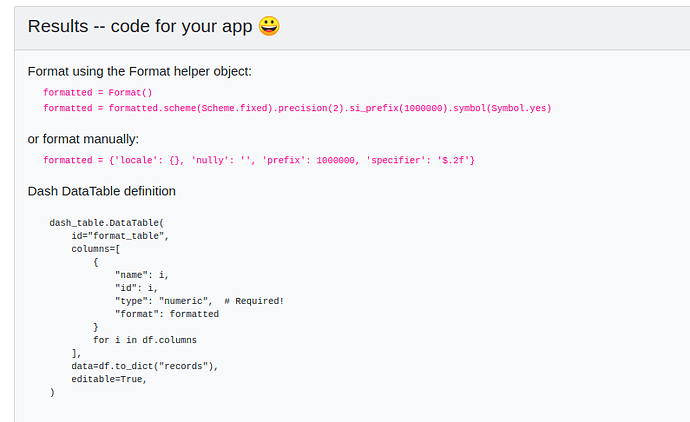
You can make selections and it will show the code needed to do the formatting:

5 Likes

I recently updated this app to included more examples and help text.

Please let me know if you have any comments or suggestions for improvements :smiley:

2 Likes

Thanks for the above solution, was wondering how to apply this to a dynamic dash table were the first column will always be datetime and the rest are numeric? Was able to apply the above to the numeric part but not sure how to combine that with the 1st column which will be datetime? something like this, but obviously got an error for the below

""" columns = [{'id': 'Title','name':'Title, 'type':'datetime'},
                        {'id': c, 'name': c, "type":"numeric",'format': Format(
                        scheme=Scheme.fixed, 
                        precision=2,
                        group=Group.yes,
                        groups=3,
                        group_delimiter=',',
                        decimal_delimiter='.',
            ), "deletable": True, "clearable": True} for c in df.iloc[3:].columns
 ]

Hi @nickmuchi

If you are looking for info on formatting dates in the table, the best way is to do the formatting prior to loading the data in the table.

Note that when you format the dates, the data type will go from datetime to string. If you want the data to be sortable in the table, the date format should be YYYY-MM-DD.

The column parameter "type": "datetime", will ensure a valid date is entered when the date column is editable. However, it won’t keep any special formatting. The user has to enter the date in YYYY-MM-DD format in order to edit the dates.

Here is a sample app to give it a try:


import dash
import dash_table
import pandas as pd

app = dash.Dash(__name__)

data = dict(
        [
            ("Date", ["2015-01-01", "2015-10-24", "2016-05-10", "2017-01-10", "2018-05-10", "2018-08-15"]),
            ("Region", ["Montreal", "Toronto", "New York City", "Miami", "San Francisco", "London"]),
            ("Temperature", [1, -20, 3.512, 4, 10423, -441.2]),
            ("Humidity", [10, 20, 30, 40, 50, 60]),
            ("Pressure", [2, 10924, 3912, -10, 3591.2, 15]),
        ]
)
df = pd.DataFrame(data)

df["Date"] = pd.to_datetime(df["Date"])
df["Date1"] = df["Date"].dt.date
df["Date2"] = df["Date"].dt.strftime("%m/%d/%Y")
df["Date3"] = df["Date"].dt.strftime("%a, %b %-d, %Y")


app.layout = dash_table.DataTable(
    data=df.to_dict("records"),
    sort_action="native",
    columns=[
        {"name": "Date", "id": "Date", "type": "datetime", "editable": False},
        {"name": "Date1", "id": "Date1", "type": "datetime"},
        {"name": "Date2", "id": "Date2", "type": "datetime"},
        {"name": "Date3", "id": "Date3", "type": "datetime"},
        {"name": "Region", "id": "Region", "type": "text"},
        {"name": "Temperature", "id": "Temperature", "type": "numeric"},
        {"name": "Humidity", "id": "Humidity", "type": "numeric"},
        {"name": "Pressure", "id": "Pressure", "type": "any"},
    ],
    editable=True,
)

if __name__ == "__main__":
    app.run_server(debug=True)

If you were just asking about how to format columns when one column is different, then this question was a python list comprehension quiz :slight_smile: . I think this should work:

columns=[{"id": "Title", "name": "Title", "type": "datetime"}]
    + [
        {
            "id": c,
            "name": c,
            "type": "numeric",
            "format": Format(
                scheme=Scheme.fixed,
                precision=2,
                group=Group.yes,
                groups=3,
                group_delimiter=",",
                decimal_delimiter=".",
            ),
            "deletable": True,
            "clearable": True,
        }
        for c in df.iloc[3:].columns
    ]
1 Like

That worked, thank you for taking the time to explain, much appreciated!

I’m glad it worked :slight_smile:

One more tip… One of my previous examples was quite verbose because it was changing some defaults - like making the thousands separator a period instead of a comma. The following will format numbers like x,xxx.xx

           "type": "numeric",
            "format": Format(
                scheme=Scheme.fixed,
                precision=2,
                group=Group.yes,               
            ),
1 Like

Hi @AnnMarieW Can you please suggest if I want to divide the same data by 10000 and convert it into money, how to do that?
Example- Changing ‘422119.49’ to ‘$0.42211949 Million’
I appreciate if you could also suggest a way to round off the final number.
Thanks in advance.

Hi @kam and welcome to the Dash community :slight_smile:

That’s a great question. I haven’t done that before, so I used my app that I posted earlier in this thread.

The table is editable, so you can enter your numbers and then make different selections to see what works. Here is what I came up with:

Then scroll down to the section that shows the code used to format the table:

To simplify the results from the app, the columns could look something like:

        columns=[
            {
                "name": i,
                "id": i,
                "type": "numeric", 
                "format": {'prefix': 1000000, 'specifier': '$.2f'}
            }
            for i in df.columns
        ]

Thank you so much for quick response and the solution @AnnMarieW . It worked.
And your app is really helpful. Thanks again :slight_smile:

1 Like

Hi @AnnMarieW , for some reasons, my initial columns ate getting hidden. I have set the width and styling like below-
style_cell_conditional=[
{
‘if’: {‘column_id’: ‘WorkType’},
‘minWidth’: ‘90px’, ‘width’: ‘90px’, ‘maxWidth’: ‘90px’,
},
{
‘if’: {‘column_id’: ‘CostType’},
‘minWidth’: ‘80px’, ‘width’: ‘80px’, ‘maxWidth’: ‘80px’,
},
],
style_cell={
‘minWidth’: ‘65px’,
‘width’: ‘65px’,
‘maxWidth’: ‘75px’,
‘overflow’: ‘hidden’,
‘textOverflow’: ‘ellipsis’,
},

Do you know why this is happening and if I should make any changes in width or do something else to fix it?
Thanks in advance.
image

You will find lots of great examples here on column width: DataTable Width & Column Width | Dash for Python Documentation | Plotly

Great News! See the new chapter in the dash documentation on formatting numbers in the DataTable :confetti_ball:

https://dash.plotly.com/datatable/data-formatting

Does anyone know of a way to format with minimum precision of n?
Basically padding the right side with 0.
For example min precision of 2:
103 → 103.00
96.1 → 96.10
95.12 → 95.23
2.123 → 2.123
103.12345 → 103.12345