Hello, I have modified an existing template for a simple app. Everything works fine when I run this app. However, I tried to have my IT department load it on their PC and the page does not load, although the console shows the server is running, with no error messages in the console. I have attached snapshots of error messages from both Firefox and Chrome. Although the error says dash_table_experiments was not found, it was successfully installed prior to running the app.

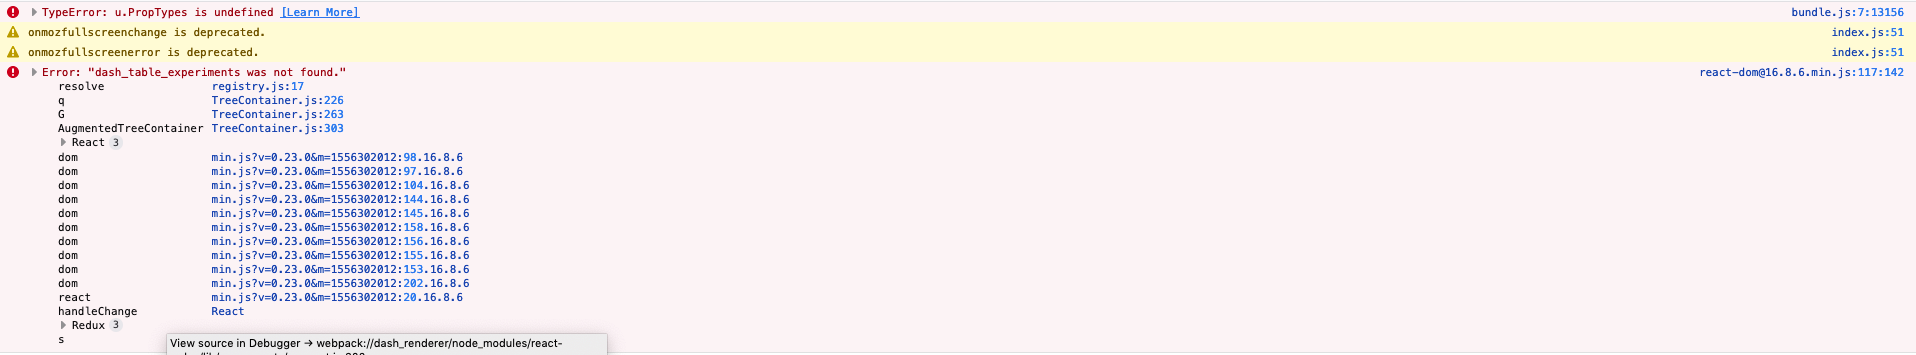
As far as we know, we have installed all dependencies, following this tutorial https://dash.plot.ly/installation. Has anyone experienced these issues?
import os
os.chdir("C:/Users/4469177/Nate/Python/scripts/Dash")

import dash
from dash.dependencies import Input, Output, State
import dash_core_components as dcc
import dash_html_components as html
import dash_table_experiments as dt
import pandas as pd
import plotly

#import numpy as np
#import json

# launch the app
app = dash.Dash()

# force offline usage
app.scripts.config.serve_locally = True
# app.css.config.serve_locally = True

# import data into pandas dataframe
test_df = pd.read_csv('C:/Users/4469177/Nate/Projects/Dash/test.csv')

# build and format web app
app.layout = html.Div([
    html.H4('Release Progress'), # page title
    dt.DataTable(
        rows = test_df.to_dict('records'), # create dict from df
#        # sort columns
#        columns=sorted(test_df.columns),

        # enable features of app
        row_selectable = True,
        filterable = True,
        sortable = True,
        selected_row_indices = [],
        id = 'datatable-test' # name the datatable
    ),
    html.Div(id='selected-indexes'),
    dcc.Graph(
        id='graph-test' # name the graph
    ),
], className="container")

# callback
@app.callback(
    Output('datatable-test', 'selected_row_indices'),
    [Input('graph-test', 'clickData')],
    [State('datatable-test', 'selected_row_indices')])

# function to update selected rows after interaction
def update_selected_row_indices(clickData, selected_row_indices):
    if clickData:
        for point in clickData['points']:
            if point['pointNumber'] in selected_row_indices:
                selected_row_indices.remove(point['pointNumber'])
            else:
                selected_row_indices.append(point['pointNumber'])
    return selected_row_indices

# callback
@app.callback(
    Output('graph-test', 'figure'),
    [Input('datatable-test', 'rows'),
     Input('datatable-test', 'selected_row_indices')])

# function to update plots
def update_figure(rows, selected_row_indices):
    dff = pd.DataFrame(rows)
    fig = plotly.tools.make_subplots(
        rows=3, cols=1,
        subplot_titles=('Release Progress',), # plot titles
        shared_xaxes=True)
    marker = {'color': ['#0074D9']*len(dff)} # plot color
    for i in (selected_row_indices or []):
        marker['color'][i] = '#FF851B' # plot color for selection
    fig.append_trace({
        'x': dff['test'], # select x and y axis
        'y': dff['Release Progress'],
        'type': 'bar', # graph type
        'marker': marker
    }, 1, 1)
#    fig.append_trace({
#        'x': dff['country'], # select x and y axis
#        'y': dff['gdpPercap'],
#        'type': 'bar', # graph type
#        'marker': marker
#    }, 2, 1)
#    fig.append_trace({
#        'x': dff['country'], # select x and y axis
#        'y': dff['pop'],
#        'type': 'bar', # graph type
#        'marker': marker
#    }, 3, 1)
    fig['layout']['showlegend'] = False # legend
    fig['layout']['height'] = 800
    fig['layout']['margin'] = {
        'l': 40,
        'r': 10,
        't': 60,
        'b': 200
    }
    fig['layout']['yaxis3']['type'] = 'log'
    return fig

#css
app.css.append_css({
    'external_url': 'https://protect-us.mimecast.com/s/oYLmCgJ71oTPABElToWl7m?domain=codepen.io'
})

# start the server
if __name__ == '__main__':
    app.run_server(debug=False)