Dash plotly_error #callbacks

Hi everyone, I got this error running the scrpt below!Could anyone help me? many thx

ERROR
Error_RideID

DATAFRAME (df3 and grouped df5)
https://drive.google.com/drive/folders/1ItPsuy1OFRxLvGpixJeGoaBVisQ9WMNL

import dash_core_components as dcc
import dash
import dash_html_components as html
import dash_table
import pandas
import plotly
import plotly.express as px
from dash.dependencies import Input, Output


external_stylesheets = ['https://codepen.io/chriddyp/pen/bWLwgP.css']
app = dash.Dash(__name__, external_stylesheets=external_stylesheets)

csv = pandas.read_csv('C:\\Users\\acer\\Desktop\\Lorenzo\\GTT\\convalide\\esportazione716_3.csv', sep=';', low_memory = False)
csv1 = pandas.read_csv('C:\\Users\\acer\\Desktop\\Lorenzo\\GTT\\convalide\\dash3.csv', sep=',', low_memory = False, encoding='latin-1')

df1 = csv1[['RIDEID' , 'WK' , 'TARIFFFAMILYID' , 'COUNT(*)']]
df2=pandas.pivot_table(df1, index = ['RIDEID' , 'WK'] , columns = 'TARIFFFAMILYID' , values = 'COUNT(*)' , aggfunc = sum,  fill_value=0)
df3=df2.reset_index().rename_axis(None, axis=1)
df4 = df3.rename(columns = {10: 'a10', 12: 'a12' , 20: 'a20', 40: 'a40', 60: 'a60'})
df5 = df4.groupby('RIDEID', as_index=False)[['a10','a12','a20','a40','a60']].sum()

print(df5)

app.layout = html.Div([
    html.H1(children='Hello World',
            style = {
                'textAlign' : 'center',
                 'color' :  '#ff0000'
            }
    ),

    html.Div('prova'),
html.Div([
    dash_table.DataTable(
        id='table',
        columns=[{"name": i, "id": i, "deletable": False, "selectable": False} for i in df5.columns],
        data=df5.to_dict('records'),
        page_size=10,
        editable=False,
        filter_action="native",
        sort_action="native",
        sort_mode="multi",
        row_selectable="multi",
        row_deletable=False,
        selected_rows=[],
        page_action="native",
        page_current=0,
        # page_action='none',
        # style_cell={
        # 'whiteSpace': 'normal'
        # },
        # fixed_rows={ 'headers': True, 'data': 0 },
        # virtualization=False,
    ),
], className='row'),

    html.Div([
        html.Div([
            dcc.Dropdown(id='linedropdown',
                options=[
                         {'label': 'abb10', 'value': 'a10'},
                         {'label': 'abb12', 'value': 'a12'},
                         {'label': 'abb20', 'value': 'a20'},
                         {'label': 'abb40', 'value': 'a40'},
                         {'label': 'abb60', 'value': 'a60'}
                ],
                value='a10',
                multi=False,
                clearable=False
            ),
        ],className='six columns'),

        html.Div([
            dcc.Dropdown(id='piedropdown',
                options=[
                     {'label': 'REASONCODE1', 'value': 'REASONCODE'},
                     {'label': 'DEVICECLASSID1', 'value': 'DEVICECLASSID'}
                ],
                value='DEVICECLASSID',
                multi=False,
                clearable=False
            ),
        ],className='six columns'),

    ],className='row'),

    html.Div([
        html.Div([
            dcc.Graph(id='linechart'),
        ],className='six columns'),

        html.Div([
            dcc.Graph(id='piechart'),
        ],className='six columns'),

    ],className='row'),

    html.H2(children='Arrivederci'),
])


@app.callback(
    Output('linechart', 'figure'),   
    [Input('table', 'selected_rows'),
     Input('linedropdown', 'value')]
     
)
def update_data(chosen_rows, linedropval):
    if len(chosen_rows)==0:
        df_filterd1 = df5[df5['RIDEID'].isin([1, 2])]
    else:
        print(chosen_rows)
        df_filterd1 = df5[df5.index.isin(chosen_rows)]


    #extract list of chosen countries
    df_filterd1 = df5[df5.index.isin(chosen_rows)]
    list_chosen_rides=df_filterd1['RIDEID'].tolist()
    #filter original df according to chosen countries
    #because original df has all the complete dates
    df_line = df4[df4['RIDEID'].isin(list_chosen_rides)]

    print(df_line)


    line_chart = px.line(
            data_frame=df_line,
            x='WK',
            y=linedropval,
            color='RIDEID',
            labels={'RIDEID1':'RIDEID', 'WK':'WK'}
            )
    line_chart.update_layout(uirevision='foo')

    return (line_chart)


if __name__ == '__main__':
    app.run_server(debug=True)`Preformatted text`

Hi @Lorenz78
Can you share dash3.csv data with us please, so we can reproduce your code.

Inside your def update_data() function, you are using df4 together with df5:

    df_line = df4[df4['RIDEID'].isin(list_chosen_rides)]

Did you mean to use df5 here?

Hi @adamschroeder , thx for your answer, I need to use df4 not df5.

Here below the links to dataframes

Here below the error

Error_RideID

Below the script.

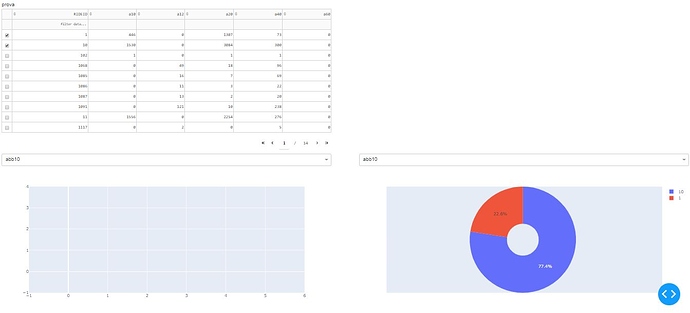
I changed a little bit respect the previous one just adding another graph, but it gives always the same kind of error. When i open the webapp i don’t see nothing as “default” in the figure. Once i choose from table, the chosen lines update both graphs

You can copy and paste the code.

Many thx
Lorenzo

import dash_core_components as dcc
import dash
import dash_html_components as html
import dash_table
import pandas
import plotly
import plotly.express as px
from dash.dependencies import Input, Output

external_stylesheets = ['https://codepen.io/chriddyp/pen/bWLwgP.css']
app = dash.Dash(__name__, external_stylesheets=external_stylesheets)

csv = pandas.read_csv('C:\\Users\\acer\\Desktop\\Lorenzo\\GTT\\convalide\\esportazione716_3.csv', sep=';', low_memory = False)
csv1 = pandas.read_csv('C:\\Users\\acer\\Desktop\\Lorenzo\\GTT\\convalide\\dash3.csv', sep=',', low_memory = False, encoding='latin-1')

df1 = csv1[['RIDEID' , 'WK' , 'TARIFFFAMILYID' , 'COUNT(*)']]
df2=pandas.pivot_table(df1, index = ['RIDEID' , 'WK'] , columns = 'TARIFFFAMILYID' , values = 'COUNT(*)' , aggfunc = sum,  fill_value=0)
df3=df2.reset_index().rename_axis(None, axis=1)
df4 = df3.rename(columns = {10: 'a10', 12: 'a12' , 20: 'a20', 40: 'a40', 60: 'a60'})
df5 = df4.groupby('RIDEID', as_index=False)[['a10','a12','a20','a40','a60']].sum()

app.layout = html.Div([
    html.H1(children='Hello World',
            style = {
                'textAlign' : 'center',
                 'color' :  '#ff0000'
            }
    ),

    html.Div('prova'),
html.Div([
html.Div([
    dash_table.DataTable(
        id='table',
        columns=[{"name": i, "id": i, "deletable": False, "selectable": False} for i in df5.columns],
        data=df5.to_dict('records'),
        page_size=10,
        editable=False,
        filter_action="native",
        sort_action="native",
        sort_mode="multi",
        row_selectable="multi",
        row_deletable=False,
        selected_rows=[],
        page_action="native",
        page_current=0,
    ),
    ], className='six columns')
], className='row'),
    html.Div([
        html.Div([
            dcc.Dropdown(id='linedropdown',
                options=[
                         {'label': 'abb10', 'value': 'a10'},
                         {'label': 'abb12', 'value': 'a12'},
                         {'label': 'abb20', 'value': 'a20'},
                         {'label': 'abb40', 'value': 'a40'},
                         {'label': 'abb60', 'value': 'a60'}
                ],
                value='a10',
                multi=False,
                clearable=False
            ),
        ],className='six columns'),

        html.Div([
            dcc.Dropdown(id='piedropdown',
                options=[
                    {'label': 'abb10', 'value': 'a10'},
                    {'label': 'abb12', 'value': 'a12'},
                    {'label': 'abb20', 'value': 'a20'},
                    {'label': 'abb40', 'value': 'a40'},
                    {'label': 'abb60', 'value': 'a60'}
                ],
                value='a10',
                multi=False,
                clearable=False
            ),
        ],className='six columns'),
    ],className='row'),

    html.Div([
        html.Div([
            dcc.Graph(id='linechart'),
        ],className='six columns'),

        html.Div([
            dcc.Graph(id='piechart'),
        ],className='six columns'),
    ],className='row'),

    html.H2(children='Arrivederci'),
])

@app.callback(
    [Output('piechart', 'figure'),
     Output('linechart', 'figure')],
    [Input('table', 'selected_rows'),
     Input('piedropdown', 'value'),
     Input('linedropdown', 'value')]
)
def update_data(chosen_rows, piedropval, linedropval):
    if len(chosen_rows)==0:
        df_filterd = df5[df5['RIDEID'].isin([1, 2])]
    else:
        print(chosen_rows)
        df_filterd = df5[df5.index.isin(chosen_rows)]

    pie_chart=px.pie(
           data_frame=df_filterd,
            names='RIDEID',
            values=piedropval,
            hole=.3,
            labels={'RIDEID':'RIDEID'}
            )

    #extract list of chosen rides
    df_filterd = df5[df5.index.isin(chosen_rows)]
    list_chosen_rides=df_filterd['RIDEID'].tolist()
    #filter original df according to chosen rides, because original df has all the dates
    df_line = df4[df4['RIDEID'].isin(list_chosen_rides)]

    line_chart = px.line(
            data_frame=df_line,
            x='WK',
            y=linedropval,
            color='RIDEID',
            labels={'RIDEID1':'RIDEID', 'WK':'WK'}
            )
    line_chart.update_layout(uirevision='foo')

    return (pie_chart,line_chart)

if __name__ == '__main__':
    app.run_server(debug=True)

I think it’s just a problem with the data filtering. Try changes the [1,2] from integers to strings like this:

df_filterd = df5[df5['RIDEID'].isin(["1","2"])]

these numbers are set as strings inside your df5.

One thing you can do to debug these errors is try to print your df more often. For example:

def update_data(chosen_rows, piedropval, linedropval):
    if len(chosen_rows)==0:
        df_filterd = df5[df5['RIDEID'].isin([1, 2])]
        print(df_filterd[:5])

Hi Lorenzo,
Did you see my post on the forum. The problem is that you are trying to plot an empty dataframe. DF5 doesn’t have anything inside because of how you filtered it.

Try to add more prints inside your function after every df that you filter, to make sure you are filtering correctly.

Sincerely,
Adam

Hi adam! thx for your answer,

probably i cannot understand the problem… at the beginning i have no selection in table, so i’m in case

if **len(chosen_rows)==0**:
    df_filterd = df5[df5['RIDEID'].isin([1, 2, 4])]
    print(df_filterd[:5])

I’d expect to have neither pie neither line chart, being my df_filterd empy. this should be ok.

I don’t understand why i get an error for a “normal” case, and how to solve it…

bye
Lorenzo

I think your error is inside the px.line():

 line_chart = px.line(
            data_frame=df_line,
            x='WK',
            y=linedropval,
            color='RIDEID',
            labels={'RIDEID1':'RIDEID', 'WK':'WK'}
            )

You are asking Dash to plot a line chart with columns that don’t exist. That’s why you’re getting the error. “RIDEID” and “WK” don’t exist because you didn’t filter the df correctly.

Try doing this:

  line_chart = px.line(
            data_frame=df_line,
            # x='WK',
            # y=linedropval,
            # color='RIDEID',
            # labels={'RIDEID1':'RIDEID', 'WK':'WK'}
            )

Now, you see you don’t get an error, you just get an empty line plot. Make sure you filter your dataframe correctly inside the function.

Ok, in this way i don’t get error, but once I select the rows in table obviously the line chart (left side) doesn’t refresh (see figure)

I cannot understand why in case of presence of two graphs my len(chosen row) == 0 condition is “not seen” by dash and so respected neither for line chart, neither for pie chart.

if len(chosen_rows)==0:
    df_filterd = df5[df5['RIDEID'].isin([1, 2, 4])]
    print(df_filterd[:5])

If I run the script just with pie chart that condition is respected: at first running (so without any selection of row in the table) the web app follows the condition behaving as I chose that RIDEID.

Thx again

Lorenzo

@Lorenz78
I’m not sure I understand your question. If I use df_filterd = df5[df5['RIDEID'].isin([1,2,4]) as integers, then, no chart is plotted. But if I use [...].isin(["1","2","4"]) as strings, then only the pie chart is plotted because you plot it with df_filtered. The line chart you are plotting with df_line which is not filtered correctly.

So:
if i put df_filterd = df5[df5[‘RIDEID’].isin([“1”,“2”,“4”]) so as strings the print(df_filterd[:5]) works (i get table)

string

if i put df_filterd = df5[df5[‘RIDEID’].isin([1,2,4]) as integers the print(df_filterd[:5]) doesn’t work (i don’t get table).

In any case in my dash the error is the same. So i don’t think the problem is there.

In my previous post i meant that if I run the same script but just with piechart return the case if len(chosen_rows)==0 is correctly managed in web app.

it is showed what i’m expecting (the case with len(chose rows ==0, so df_filterd = df5[df5[‘RIDEID’].isin([“1”, “2”, “4”])]) and there is no any error …

hope to explain :slight_smile: