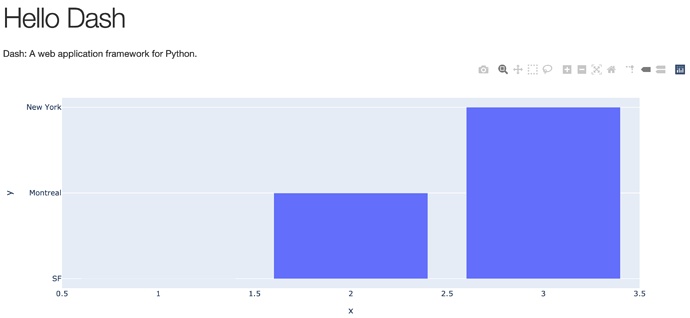
I suspect this is due to the reference of New in dash 0.30.0 and dash-renderer 0.15.0 and I am using the latest Dash 1.13.4 but the first examples on Part 2. Layout | Dash for Python Documentation | Plotly are failing with:
Traceback (most recent call last):
  File "/Users/steve/PycharmProjects/marketemp/dash999.py", line 16, in <module>
    fig = px.bar(df, x="x", y=["SF", "Montreal"], barmode="group")
  File "/Users/steve/PycharmProjects/marketemp/venv/lib/python3.7/site-packages/plotly/express/_chart_types.py", line 313, in bar
    layout_patch=dict(barmode=barmode),
  File "/Users/steve/PycharmProjects/marketemp/venv/lib/python3.7/site-packages/plotly/express/_core.py", line 1432, in make_figure
    args, constructor, trace_patch
  File "/Users/steve/PycharmProjects/marketemp/venv/lib/python3.7/site-packages/plotly/express/_core.py", line 1275, in infer_config
    args = build_dataframe(args, all_attrables, array_attrables)
  File "/Users/steve/PycharmProjects/marketemp/venv/lib/python3.7/site-packages/plotly/express/_core.py", line 1084, in build_dataframe
    % (field, len(argument), str(list(df_output.columns)), length)
ValueError: All arguments should have the same length. The length of argument `y` is 2, whereas the length of previous arguments ['x'] is 3
I am not sure why the length of y arguments (number of graph elements) and x arguments (number of points each y element is graphing) need to match. I would suggest that this example (or this error condition) needs a rev.
adding a third element gets it to run:
df = pd.DataFrame({"x": [1, 2, 3], "SF": [4, 1, 2], "Montreal": [2, 4, 5], "New York": [4, 3, 2]})

fig = px.bar(df, x="x", y=["SF", "Montreal", "New York"], barmode="group")
but the graph is definitely wrong:
Suspecting this is on the plotly express side (I have plotly 4.7.1).
and finally, I got example 3 from https://dash.plotly.com/dash-core-components/graph working in a snap so unless there’s a passionate reason to demonstrate Plotly Express, that should probably be the substitution…
Hello,
Can you please share what version of the plotly.py package you have installed in your development environment? You can do this by running:
import plotly

print(plotly.__version__)
If you do not have the latest version, which is 4.8.2, I would recommend going to https://plotly.com/python/getting-started/ to learn how to get the latest version using either pip or conda.
Support for wide format data of the type used in the Dash layout examples you cite was added in plotly.py v4.8.1, so if you are using an older version that might be a reason you are seeing this error.
The examples in the Dash documentation are on the latest version of plotly.py, so if you have an older version you might not be able to take advantage of all the features that are used in every example.
To learn more about what kinds of data PX can accept, please look at the documentation at https://plotly.com/python/px-arguments/ and https://plotly.com/python/wide-form/.
I hope that helps!
thanks, I was running plotly 4.7.1.
I really thought I had pip upgraded everything in my requirements.txt (plotly is there) last week but somehow plotly didn’t get upgraded.
The problem is px.bar needs a long table, but the code above generated a wide table. Try change the code like this:
df = pd.DataFrame({"x": [1, 2, 3], "SF": [4, 1, 2], "Montreal": [2, 4, 5]})

long_df = df.set_index('x').stack().reset_index()
long_df.columns = ['x','city','number']

fig = px.bar(long_df, x="x", y='number', color="city", barmode="group")
We added wide-form data support in 4.8.0, so we will add a note to the Dash docs saying that the examples are intended to run in a version higher than that.
1 Like
