Hi,
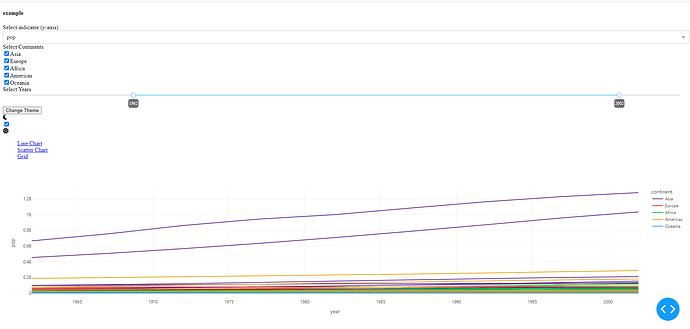
I’m using a dash bootstrap examples that uses ThemeChangerAIO to change theme of the app. My problem is that when I want to use the app without an internet connection, some themes like LUX are not seen correctly and when I connect to the internet it is seen correctly again.
For my application I need to run the app locally without internet connection and with all the themes seen correctly.
Espected answer
The modification of my code or how to download this themes and import this locally.
App with internet connection
App without internet connection
The code
from dash import Dash, dcc, html, Input, Output, callback, Patch, clientside_callback
import plotly.express as px
import plotly.io as pio
import dash_bootstrap_components as dbc
from dash_bootstrap_templates import ThemeChangerAIO, template_from_url
import dash_ag_grid as dag

#ingreso los datos
df = px.data.gapminder()
years = df.year.unique()
continents = df.continent.unique()

print(df.info())


# stylesheet with the .dbc class to style  dcc, DataTable and AG Grid components with a Bootstrap theme
dbc_css = r"layout_test\dbc.min.css"

app = Dash(__name__, external_stylesheets=[dbc.themes.BOOTSTRAP, dbc.icons.FONT_AWESOME, dbc_css])

#like html span, inline block of elements for the switch in this case
#"fa fa-moon" moon icon
#"fa fa-sun" sun icon
#d-*-inline-block utility classes can be applied to any Dash component to quickly style them without the need to write custom CSS rule
#ms-1 set margin set the margin or padding to $spacer * .25
# persistence make that the value not change when the page is refreshed
color_mode_switch =  html.Span(
    [
        dbc.Label(className="fa fa-moon", html_for="switch"),
        dbc.Switch( id="switch", value=True, className="d-inline-block ms-1", persistence=True),
        dbc.Label(className="fa fa-sun", html_for="switch"),
    ]
)

# The ThemeChangerAIO loads all 52  Bootstrap themed figure templates to plotly.io
#hstack adjust the button stiles gap-3 the size mt-2 the margin space
#class name info: https://dashcheatsheet.pythonanywhere.com/
theme_controls = html.Div([ThemeChangerAIO(aio_id="theme"), color_mode_switch],
    className="hstack gap-3 mt-2"
)
#only header
header = html.H4(
    "example", className="bg-primary text-white p-2 mb-2 text-center"
)
#talbe
grid = dag.AgGrid(
    id="grid",
    columnDefs=[{"field": i} for i in df.columns],
    rowData=df.to_dict("records"),
    defaultColDef={"flex": 1, "minWidth": 120, "sortable": True, "resizable": True, "filter": True},
    dashGridOptions={"rowSelection":"multiple"},
)
#drpdown, with not clearable with Utility: Spacing margin configuration in classname
dropdown = html.Div(
    [
        dbc.Label("Select indicator (y-axis)"),
        dcc.Dropdown(
            ["gdpPercap", "lifeExp", "pop"],
            "pop",
            id="indicator",
            clearable=False,
        ),
    ],
    className="mb-4",
)
#chech list
checklist = html.Div(
    [
        dbc.Label("Select Continents"),
        dbc.Checklist(
            id="continents",
            options=continents,
            value=continents,
            inline=True,
        ),
    ],
    className="mb-4",
)

slider = html.Div(
    [
        dbc.Label("Select Years"),
        dcc.RangeSlider(
            years[0],
            years[-1],
            5,
            id="years",
            marks=None,
            tooltip={"placement": "bottom", "always_visible": True},
            value=[years[2], years[-2]],
            className="p-0",
        ),
    ],
    className="mb-4",
)
theme_colors = [
    "primary",
    "secondary",
    "success",
    "warning",
    "danger",
    "info",
    "light",
    "dark",
    "link",
]
colors = html.Div(
    [dbc.Button(f"{color}", color=f"{color}", size="sm") for color in theme_colors]
)
colors = html.Div(["Theme Colors:", colors], className="mt-2")

#create a card with the continent selection
controls = dbc.Card(
    [dropdown, checklist, slider],
    body=True,
)

tab1 = dbc.Tab([dcc.Graph(id="line-chart", figure=px.line(template="bootstrap"))], label="Line Chart")
tab2 = dbc.Tab([dcc.Graph(id="scatter-chart", figure=px.scatter(template="bootstrap"))], label="Scatter Chart")
tab3 = dbc.Tab([grid], label="Grid", className="p-4")
tabs = dbc.Card(dbc.Tabs([tab1, tab2, tab3]))

app.layout = dbc.Container(
    [
        header,
        dbc.Row([
            dbc.Col([
                controls,
                # ************************************
                # Uncomment line below when running locally!
                # ************************************
                theme_controls
            ],  width=4),
            dbc.Col([tabs, colors], width=8),
        ]),
    ],
    fluid=True,
    className="dbc dbc-ag-grid",
)


@callback(
    Output("line-chart", "figure" ),
    Output("scatter-chart", "figure"),
    Output("grid", "rowData"),
    Input("indicator", "value"),
    Input("continents", "value"),
    Input("years", "value"),
    Input(ThemeChangerAIO.ids.radio("theme"), "value"),
    Input("switch", "value"),
)
def update(indicator, continent, yrs, theme, color_mode_switch_on):

    if continent == [] or indicator is None:
        return {}, {}, []

    theme_name = template_from_url(theme)
    template_name = theme_name if color_mode_switch_on else theme_name + "_dark"

    dff = df[df.year.between(yrs[0], yrs[1])]
    dff = dff[dff.continent.isin(continent)]

    fig = px.line(
        dff,
        x="year",
        y=indicator,
        color="continent",
        line_group="country",
        template=template_name
    )

    fig_scatter = px.scatter(
        dff[dff.year == yrs[0]],
        x="gdpPercap",
        y="lifeExp",
        size="pop",
        color="continent",
        log_x=True,
        size_max=60,
        template=template_name,
        title="Gapminder %s: %s theme" % (yrs[1], template_name),
    )

    return fig, fig_scatter, dff.to_dict("records")


# updates the Bootstrap global light/dark color mode
#This callback run in the browser not trougth the dash app
clientside_callback(
    """
    switchOn => {
       switchOn
         ? document.documentElement.setAttribute('data-bs-theme', 'light')
         : document.documentElement.setAttribute('data-bs-theme', 'dark')
       return window.dash_clientside.no_update
    }
    """,
    Output("switch", "id"),
    Input("switch", "value"),
)


# This callback isn't necessary, but it makes updating figures with the new theme much faster
@callback(
    Output("line-chart", "figure", allow_duplicate=True ),
    Output("scatter-chart", "figure", allow_duplicate=True),
    Input(ThemeChangerAIO.ids.radio("theme"), "value"),
    Input("switch", "value"),
    prevent_initial_call=True
)
def update_template(theme, color_mode_switch_on):
    theme_name = template_from_url(theme)
    template_name = theme_name if color_mode_switch_on else theme_name + "_dark"


    patched_figure = Patch()
    # When using Patch() to update the figure template, you must use the figure template dict
    # from plotly.io  and not just the template name
    patched_figure["layout"]["template"] = pio.templates[template_name]
    return patched_figure, patched_figure


#Launch the app
if __name__ == "__main__":
    app.run_server(debug=True)```

This run in W10:
-  dash  2.14.2
-  plotly 5.17.0
- dash_bootstrap_components 1.5.0
- dash_bootstrap_templates 1.1.2
- dash_ag_grid 31.0.1
