Dash Application: Pie Chart not displaying

Hello. I am new to Dash and still figuring this out. I loaded a CSV file and tried generating a pie chart for columns “Industry” and “Percentage” driven by the Client column:
image

So what i want to do is like i pick from drop down:Client
Then Pie Chart generate report for Industry and Percentage.

This is my code…it runs but no Pie-.
I know am doing something wrong but can quite figure it out. Please i really like need help.
Thanks alot!

import dash
import dash_core_components as dcc
import dash_html_components as html
import pandas as pd
import plotly.graph_objs as go

df = pd.read_csv(‘C:/Users/user/Desktop/Programs/machine Learning/Motor.csv’,encoding = “utf8”)
df.reset_index(drop=True)

print (df)
app = dash.Dash()
app.config.supress_callback_exceptions = True

available_indicators = df['Client '].unique()

app.layout = html.Div([

    html.Div([
        dcc.Dropdown(
            id='crossfilter-xaxis-column',
            options=[{'label': i, 'value': i} for i in available_indicators],value='ABB'),
             ], style={'width': '10%', 'display': 'inline-block'}),


    html.Div([
        dcc.Graph(
                id='crossfilter-indicator-pie')
             ], style={'width': '60%', 'display': 'inline-block'})

])

@app.callback(
dash.dependencies.Output(‘crossfilter-indicator-pie’, ‘figure’),
[dash.dependencies.Input(‘crossfilter-xaxis-column’, ‘value’)])

def display_content(client_name):
dff = df[df['Client '] == client_name]
piedata = go.Pie(labels=dff[‘Industry’],values=dff[‘Percentage’])
return {
‘data’:[piedata],
‘layout’: {‘height’: 250,‘margin’: {‘l’: 20, ‘b’: 30, ‘r’: 10, ‘t’: 10}}
}

if name == ‘main’:
app.run_server(
debug=False,
host=‘127.0.0.1’,
port=8050
)
What is the type of the values in your percentage column?
My first guess is that go.Pie cannot handle a string like ‘10%’ and translate it into a number.

(in line: piedata = go.Pie(labels=dff[‘Industry’],values=dff[‘Percentage’]))

@Blaceus !!! You are gOD, but of course with a small g. Thanks.

1 Like

Not able to run this code, can you help me figure this out. I have the same problem where I have to csv file and plot graph on local server with that.

Thanks

Check if pandas added a space to Client…like: 'Client ’ and not ‘Client’. I had that problem. But post code so we look what’s going on.

Hey!

I just started with Dash and I also have the problem with a not displayed pie chart.
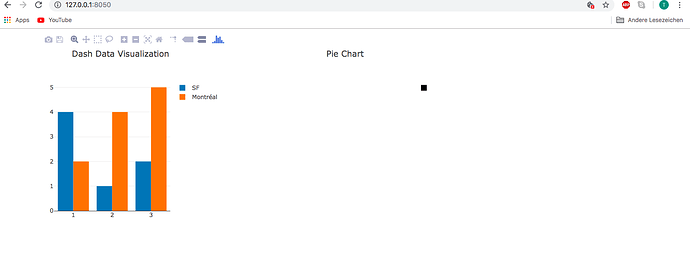
These are my first steps and I only tried to add two charts. A bar chart and a pie chart.
The bar chart is displayed but the pie chart is not.

Here is my source code:

import dash
import dash_core_components as dcc
import dash_html_components as html
import plotly.plotly as py
import plotly.graph_objs as go

external_stylesheets = [‘https://codepen.io/chriddyp/pen/bWLwgP.css’]
app = dash.Dash(name, external_stylesheets=external_stylesheets)

dataPieChart = [
{
‘values’: [[10, 90], [5, 95], [15, 85], [20, 80]],
‘type’: ‘pie’,
},
]

app.layout = html.Div(
children=[

    # charts
    html.Div([

        html.Div([
            dcc.Graph(
                id='figure1',
                figure={
                    'data': [
                        {'x': [1, 2, 3], 'y': [4, 1, 2], 'type': 'bar', 'name': 'SF'},
                        {'x': [1, 2, 3], 'y': [2, 4, 5], 'type': 'bar', 'name': u'Montréal'},
                    ],
                    'layout': {
                        'title': 'Dash Data Visualization'
                    }
                }
            )
        ], className="four columns",
           style={"margin-left": "30px"},
        ),


        html.Div([
            dcc.Graph(
                id='pieChart',
                figure={
                    'data': dataPieChart,
                    'layout': {
                        'title': 'Pie Chart'
                    }
                }
            )
        ], className="four columns",
            style={"margin-left": "30px"},
        ),

    ],
        className="row"
    ),

],
className=“row”,
style={“margin”: “0%”},
)

if name == ‘main’:
app.run_server(debug=True)

And that is what I see when I open the browser:

Any ideas?

leaving this here for others that might have the same issue… I had the same problem as @dash0311 above, the solution for me was to remove commas from the list of strings for ‘values’ (lol).
I would try just using go.PIe - the following worked for my use case:

                 dcc.Graph(id='device_usage',
                           figure=go.Figure(
                               data=[go.Pie(labels=['Desktop', 'Mobile', 'Tablet'],
                                            values=['42344', '1864', '2390'])],
                               layout=go.Layout(
                                   title='Device Usage')
                           ))