Hello,
I am having issues getting Dash AG Grid to dark mode. I am following the instructions from Introduction to Theming | Dash for Python Documentation | Plotly
Here is my code:
import dash_ag_grid as dag
from dash import Dash, html
import pandas as pd
import dash_bootstrap_components as dbc

app = Dash(__name__, external_stylesheets=[dbc.themes.SPACELAB, dbc.icons.FONT_AWESOME])

df = pd.read_csv(
    "https://raw.githubusercontent.com/plotly/datasets/master/ag-grid/space-mission-data.csv"
)

app.layout = html.Div(
    [
        dag.AgGrid(
            id="grid",
            dashGridOptions={
                "theme": {"function": "myDarkBalham(themeBalham, agGrid)"}
            },
            columnDefs=[{"field": i} for i in df.columns],
            rowData=df.to_dict("records"),
            columnSize="autoSize",
        )
    ],
)


if __name__ == "__main__":
    app.run(debug=True)
and the javascript:
var defined_themes = (window.dashAgGridFunctions = window.dashAgGridFunctions || {});

defined_themes.myDarkBalham = (theme, agGrid) => {
    return theme.withPart(agGrid.colorSchemeDarkWarm);
};
The resulting table:
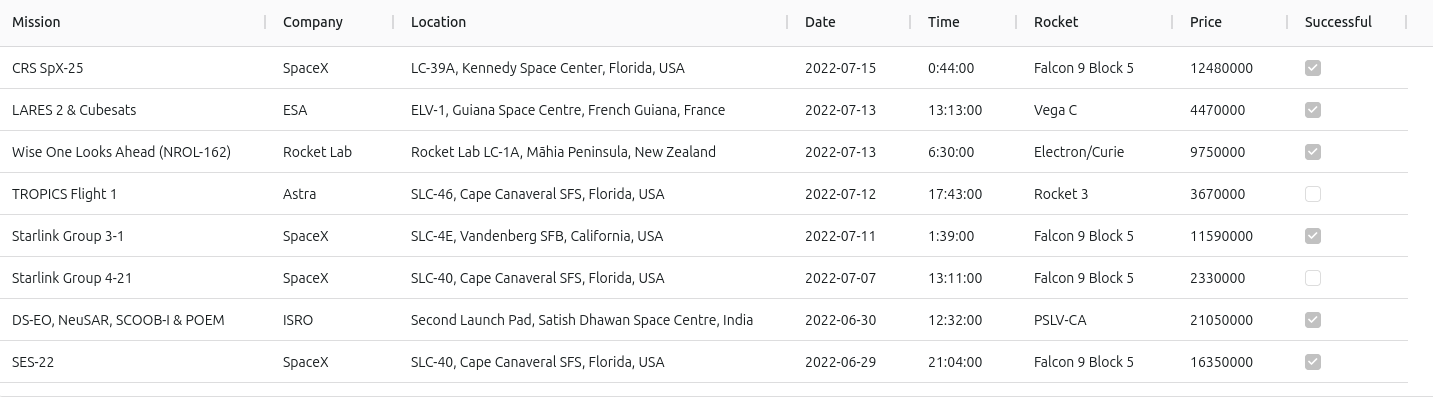
Sadly it is not in dark mode, as I had hoped…
Any help is much appreciated !