Hi, I am currently starting to work with plotly in javascript solution. My question, is it possible to create crosslinks among plots?
For example, I have below plots:
<script>
    var values = [
      [1, 2, 3, 4, 5],
      [2, 4, 6, 8, 10],
      [5, 10, 15, 20, 25],
      [10, 20, 30, 40, 50]]
</script>

<center id="GPSTraces"></center>
<script>
    var trace = {
        type: 'scatter3d',
        mode: 'lines+markers',
        x: values[0],
        y: values[2],
        z: values[3]
    }

    var data = [trace]

    var layout = {
        height: 500,
        width: 1000,
        title: 'GPS Traces',
        scene: {
            xaxis: { title: 'X' },
            yaxis: { title: 'Y' },
            zaxis: { title: 'Z' },
            aspectratio: {
                x: 2,
                y: 2,
                z: 0.75
            }
        },
        autosize: true,
        margin: {
            l: 0,
            r: 0,
            b: 20,
            t: 30,
            pad: 0
        },
    }

    Plotly.newPlot('GPSTraces', data, layout, { responsive: true });
    window.onresize = function () { Plotly.Plots.resize('GPSTraces'); };
</script>

<center id="2DGPSTraces"></center>
<script>
    var traces = {
        x: values[1],
        y: values[4],
        mode: 'lines+markers'
    }

    var data = [traces]

    var layout = {
        autosize: true,
        scene: {
            xaxis: { title: 'X' },
            yaxis: { title: 'Y' }
        }

    }
    Plotly.newPlot('2DGPSTraces', data)
</script>
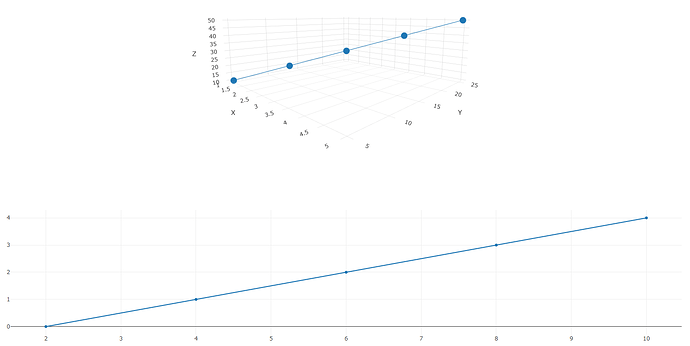
The results are shown below:
My goal is to be able to click a point on figure 1, and it will highlight figure on point 2 and vice versa. Can anyone advice on how to achieve this?
Thanks
