Hi everyone,
I want to plot a surface function Z(rho, theta), where rho is the radial and theta is the azimuth coordinates. My first step is to create a meshgrid of rho and theta and calculate the function Z at each grid. I then convert the rho-theta grid to X-Y Cartesian coordinates grid. The Surface plot and its z-projection contour in fig00 are based on X,Y,Z coordinates and are all correct. I have a problem when I want to plot only the contour in fig0.
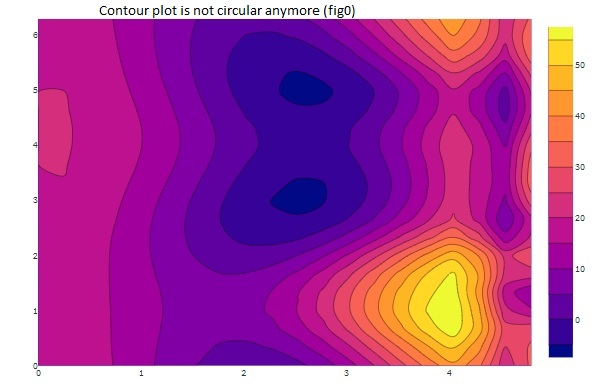
go.Contour requires one-dimensional coordinates that in Cartesian coordinates are no longer uniform. Moreover, using rho-theta arrays does not produce circular contours as is shown in fig0.
Would anyone be able to assist me with this?
Thank you very much.
Payman
‘’’
rho = np.linspace(0, dia / 2, 20)
theta= np.linspace(0, 2 * np.pi, 20)
RR, P = np.meshgrid(rho, theta)
X, Y = RR * np.cos(P), RR * np.sin(P)
trace00 = go.Surface(x= X, y= Y, z= ZZ, colorscale=‘rainbow’)
layout00 = go.Layout(title=’ Tear Layer Map’)
fig00 = go.Figure(data=[trace00], layout=layout00)
fig00.update_traces(contours_z=dict(show=True, usecolormap=True,
highlightcolor=“limegreen”, project_z=True))
st.plotly_chart(fig00)
trace0 = go.Contour( x= RR[0,:], y= P[:,0], z= ZZ, connectgaps=True)
layout0 = go.Layout(margin=dict(l=0, r=0, b=0, t=0))
fig0 = go.Figure(data=[trace0], layout=layout0)
fig0.update_layout(polar_bargap=0)
st.plotly_chart(fig0)
‘’’