I am trying to produce a Heatmap with R plotly. This is the reproducible example:
test <- structure(list(s1 = c(0L, 0L, 1L, 0L, 1L, 1L), s2 = c(1L, 1L,
0L, 1L, 0L, 0L), s3 = c(0L, 0L, 0L, 0L, 0L, 0L), s4 = c(0L, 0L,
0L, 0L, 0L, 0L), s5 = c(0L, 0L, 0L, 0L, 0L, 0L), s6 = c(0L, 0L,
0L, 0L, 0L, 0L)), .Names = c("s1", "s2", "s3", "s4", "s5", "s6"
), row.names = c("5HT2 type receptor mediated signaling pathway",
"5HT3 type receptor mediated signaling pathway", "5-Hydroxytryptamine degredation",
"Alpha adrenergic receptor signaling pathway", "Alzheimer disease-amyloid secretase pathway",
"Angiogenesis"), class = "data.frame")
And the code to produce the heatmap in plotly:
f1 <- list(
    family = "Arial, sans-serif",
    size = 5,
    color = "lightgrey")

f2 <- list(
    family = "Old Standard TT, serif",
    size = 10,
    color = "black")

a <- list(
  title = "",
  titlefont = f1,
  showticklabels = TRUE,
  tickangle = 45,
  tickfont = f2,
  exponentformat = "E")

plot_ly(z = as.matrix(test),
        zmin=0,
        zmax=1,
        x = colnames(test),
        xgap = 2,
        y = rownames(test),
        ygap =2,
        type = "heatmap",
        colorbar=list(ypad = 30, tickmode="array", tickvals = c(0,1), color = 2, autocolorscale = F )) %>%
  layout(xaxis = a,
         margin = list(l =500, r = 10, b = 200, t = 10))
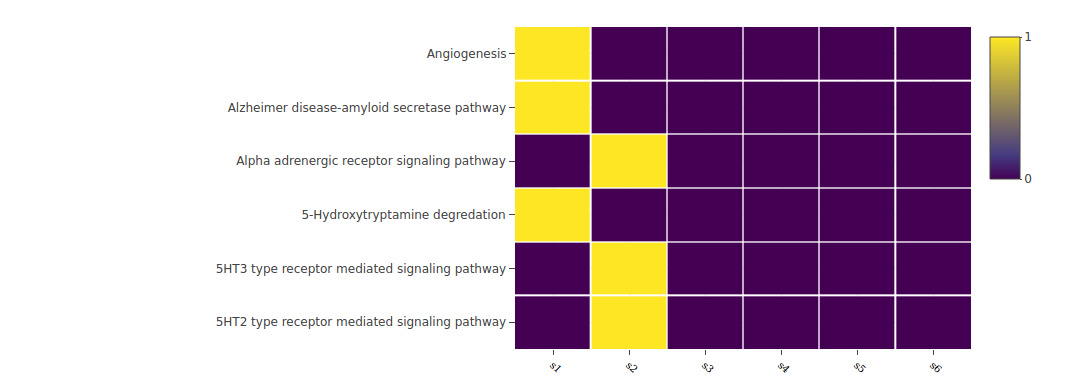
As you see, the produced plot has a scale that is continuous. I have found this StackOverflow question where the author asked a similar question. I tried to replicate the solutions provided by the answers but I couldn’t get to the bottom of it. Could you please tell me how to set the scale to discrete instead of continuous color ?
EDIT: The answer to above question has been resolved here
On the other hand, I have something like this:
colMax <- function(data) sapply(data, max, na.rm = TRUE)
colMin <- function(data) sapply(data, min, na.rm = TRUE)
big_data <- structure(list(`#Log2FC_00e41e6a` = c(0, 0, 0, 0, 0, 0), `#Log2FC_0730216b` = c(0,
0, 0, 2.85798206145049, 0, 0), `#Log2FC_07ccb4e9` = c(-2.92159741497064,
0, -2.32475763591175, 0, 0, 0), `#Log2FC_1426b4bf` = c(0, 0,
0, -2.95962954629017, 0, 0), `#Log2FC_181c6d37` = c(0, 0, 0,
0, 0, 0), `#Log2FC_1d7ffbe7` = c(0, 0, 0, 0, 0, 0), `#Log2FC_1f4ff2c7` = c(0,
0, 0, 0, 0, 0), `#Log2FC_28689d40` = c(0, 0, 0, 0, 0, 0), `#Log2FC_2c7ec330` = c(0,
0, 0, 0, 0, 0), `#Log2FC_2def2a53` = c(0, 0, 0, 0, 0, 0), `#Log2FC_33283111` = c(0,
0, 0, 0, 0, 0), `#Log2FC_3971a2f0` = c(0, 0, 0, 0, 0, 0), `#Log2FC_3e290dc6` = c(0,
0, 0, 0, -3.92985081346419, 0), `#Log2FC_42b7d14f` = c(0, 0,
0, 0, 0, 0), `#Log2FC_4bc71292` = c(0, 0, 0, -4.13953267110592,
0, 0), `#Log2FC_64bf32c9` = c(0, 0, 0, 0, 0, 0), `#Log2FC_6641a298` = c(0,
0, 0, 0, 0, 0), `#Log2FC_6845076e` = c(0, 0, 3.31538116051437,
-2.69796009862513, 0, 0), `#Log2FC_68fc3693` = c(0, 0, 0, 0,
0, 0), `#Log2FC_698ce9a9` = c(0, 0, 0, 0, 0, 0), `#Log2FC_73f875cb` = c(0,
0, 0, 0, 0, 0), `#Log2FC_7bc369b7` = c(0, 0, 0, 0, 0, 0), `#Log2FC_804ee985` = c(0,
0, 0, 0, 0, 0), `#Log2FC_854a481b` = c(0, 0, 0, 0, 0, 0), `#Log2FC_88c87cce` = c(0,
0, 0, 0, 0, 0), `#Log2FC_8ad78c4f` = c(0, 0, 0, 0, 0, 0), `#Log2FC_8dc53431` = c(0,
0, 0, -3.13094580452027, 0, 0), `#Log2FC_91e249a6` = c(0, 0,
0, 4.25687834509947, 0, 0), `#Log2FC_9519be01` = c(0, 0, 0, 0,
0, 0), `#Log2FC_98240f19` = c(0, 0, 0, 0, 0, 0), `#Log2FC_9b84601b` = c(0,
0, 0, 0, 0, 0), `#Log2FC_9d499039` = c(0, 0, -2.14156728583979,
0, 0, 0), `#Log2FC_a279d5aa` = c(0, 0, 0, 0, 0, 0), `#Log2FC_a7b76662` = c(0,
0, 0, 0, 0, 0), `#Log2FC_aca312ab` = c(0, 0, 0, 0, 0, 0), `#Log2FC_acd5ceef` = c(0,
0, 0, 0, 0, 0), `#Log2FC_aeec3005` = c(0, 0, 0, 0, 0, 0), `#Log2FC_b424b73a` = c(0,
0, 0, 0, 0, 0), `#Log2FC_b5b3871c` = c(0, 0, 0, 0, 0, 0), `#Log2FC_b751083d` = c(0,
0, 0, 0, 0, 0), `#Log2FC_c606918f` = c(0, 0, 0, 0, 0, 0), `#Log2FC_ce2b7e17` = c(0,
0, 0, 0, 0, 0), `#Log2FC_d1fd7be0` = c(-3.81895750409048, 0,
0, -4.18789723000615, 0, 0), `#Log2FC_da07da37` = c(0, 0, -2.8457790349891,
0, 0, 0), `#Log2FC_da5b0169` = c(0, 0, 0, 4.18748920417447, 0,
0), `#Log2FC_e0dfc37a` = c(0, 0, 0, 0, 0, 0), `#Log2FC_e90ab72a` = c(0,
0, 0, 0, 0, 0), `#Log2FC_ec3870c9` = c(0, 0, 0, 0, 0, 0), `#Log2FC_f228ef91` = c(0,
0, 0, 0, 0, 0), `#Log2FC_f25bae1a` = c(0, 7.40886597210195, 0,
0, 0, 0), `#Log2FC_f59b9c65` = c(0, 0, 0, 0, 0, 0), `#Log2FC_f6c61a22` = c(0,
0, 0, 0, 0, 0), `#Log2FC_f98366df` = c(0, 0, 0, 0, 0, 0), `#Log2FC_fb7e9935` = c(0,
0, 0, -3.34196674167846, 0, -8.27810074522414)), .Names = c("#Log2FC_00e41e6a",
"#Log2FC_0730216b", "#Log2FC_07ccb4e9", "#Log2FC_1426b4bf", "#Log2FC_181c6d37",
"#Log2FC_1d7ffbe7", "#Log2FC_1f4ff2c7", "#Log2FC_28689d40", "#Log2FC_2c7ec330",
"#Log2FC_2def2a53", "#Log2FC_33283111", "#Log2FC_3971a2f0", "#Log2FC_3e290dc6",
"#Log2FC_42b7d14f", "#Log2FC_4bc71292", "#Log2FC_64bf32c9", "#Log2FC_6641a298",
"#Log2FC_6845076e", "#Log2FC_68fc3693", "#Log2FC_698ce9a9", "#Log2FC_73f875cb",
"#Log2FC_7bc369b7", "#Log2FC_804ee985", "#Log2FC_854a481b", "#Log2FC_88c87cce",
"#Log2FC_8ad78c4f", "#Log2FC_8dc53431", "#Log2FC_91e249a6", "#Log2FC_9519be01",
"#Log2FC_98240f19", "#Log2FC_9b84601b", "#Log2FC_9d499039", "#Log2FC_a279d5aa",
"#Log2FC_a7b76662", "#Log2FC_aca312ab", "#Log2FC_acd5ceef", "#Log2FC_aeec3005",
"#Log2FC_b424b73a", "#Log2FC_b5b3871c", "#Log2FC_b751083d", "#Log2FC_c606918f",
"#Log2FC_ce2b7e17", "#Log2FC_d1fd7be0", "#Log2FC_da07da37", "#Log2FC_da5b0169",
"#Log2FC_e0dfc37a", "#Log2FC_e90ab72a", "#Log2FC_ec3870c9", "#Log2FC_f228ef91",
"#Log2FC_f25bae1a", "#Log2FC_f59b9c65", "#Log2FC_f6c61a22", "#Log2FC_f98366df",
"#Log2FC_fb7e9935"), row.names = c("A1BG-AS1", "A1CF", "A2M",
"A2ML1", "A4GALT", "AADAC"), class = "data.frame")
and the plotly:
plot_ly(z = as.matrix(test),
        zmin=round(min(colMin(test))),
        zmax=round(max(colMax(test))),
        x = colnames(test),
        xgap = 2,
        y = rownames(test),
        ygap =2,
        type = "heatmap",
        colorbar=list(ypad = 100,
                      tickmode="array") ) %>%
    layout(xaxis = a,
           margin = list(l =90,
                         r = 10,
                         b = 100,
                         t = 10))

My question is how can I set the continuous colorbar from red (lowest) to black (0) to green (highest) color ?
Thanks