Hi
is it possible to connect markers in a categorical strip plot? For example, in category ‘A’ I would like to connect both markers or indicate the trend from blue to red with an arrow.
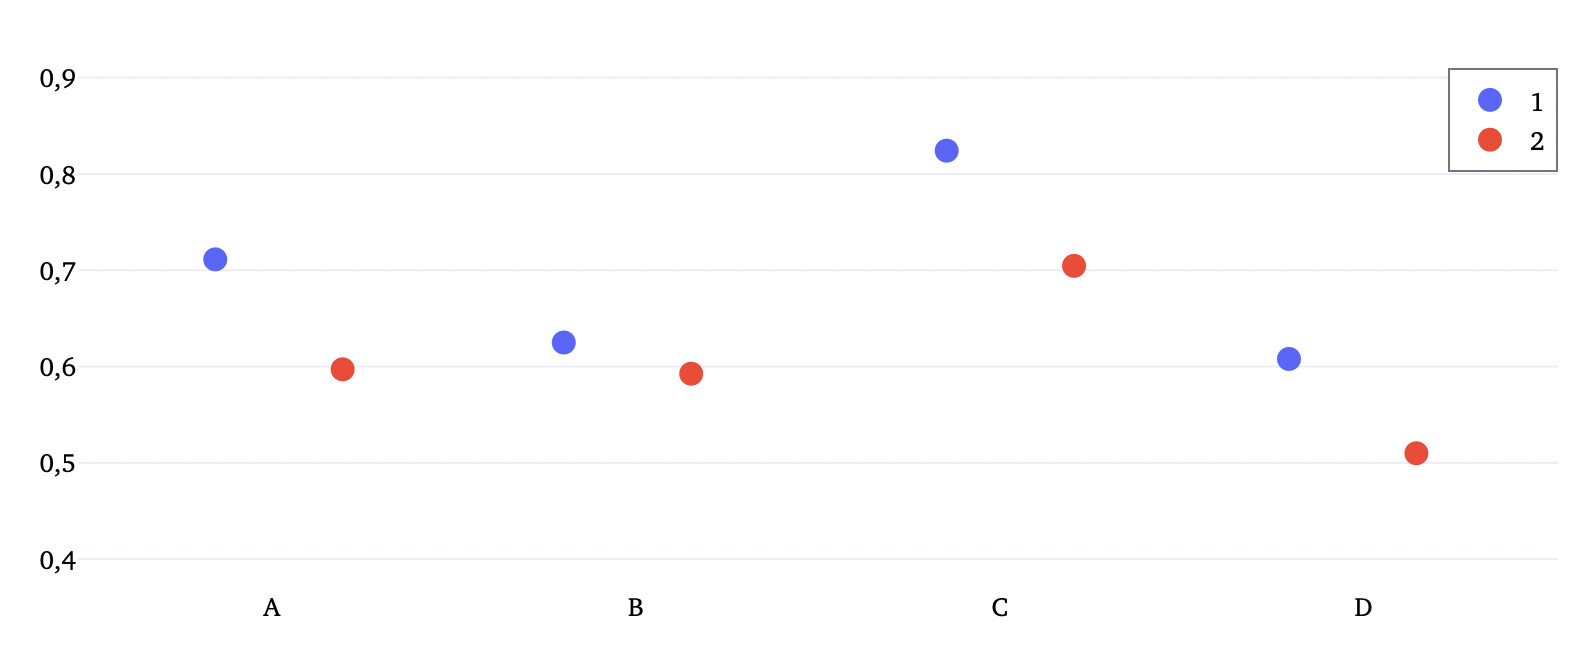
Currently I’m just using a simple strip plot with some layout adjustments.
fig = px.strip(df, x='parameter', y='value', color='position')
Maybe it would be easier to use multiple scatter or line plots?
Thanks for your help