Conditional Color Formatting for Databars in Dash AgGrid

Hi All,

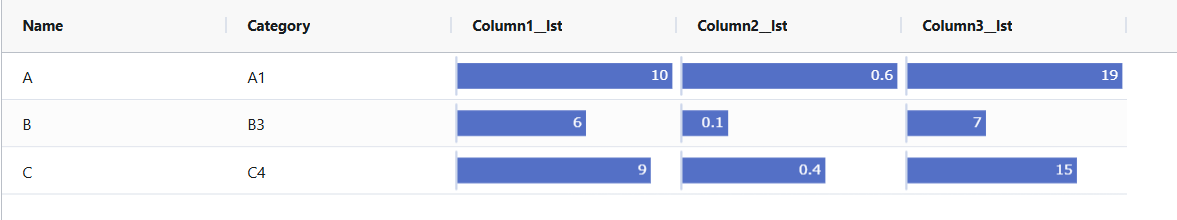
I am looking for a solution where I can color my Databars (Sparklines Bars) in Dash AgGrid based on column value conditions. Basically, I wanna color the bars Red if that row value is less than column avg else Green.

PFA my code and screenshot attached. I currently do not have any kinda color formatting for the bars.

Hope to hear from you soon.

@jinnyzor, @adamschroeder, @eliza, @celia

Best,
Shail.

import dash_ag_grid as dag
from dash import Dash, html
import pandas as pd

app = Dash(__name__)
df = pd.DataFrame(
    {
        "Name": ["A", "B", "C"],
        "Category": ["A1", "B3", "C4"],
        "column1": [10, 6, 9],
        "column2": [0.6, 0.13, 0.4],
        "column3": [19, 7, 15],
    }
)
sla__vals = {"column1": 7, "column2": 0.5, "column3": 15}


def get__value__bars__coldef(list__of__cols, df):
    coldefs = []
    for col in list__of__cols:
        df[f"{col}__lst"] = [[v] for v in df[col]]
        coldefs.append(
            {
                "field": f"{col}__lst",
                "cellRenderer": "agSparklineCellRenderer",
                "cellRendererParams": {
                    "sparklineOptions": {
                        "type": "bar",
                        "valueAxisDomain": [
                            0,
                            max(v[0] for v in df[f"{col}__lst"]),
                        ],  # force scaling across rows
                        "fill": "#5470c6",
                        # bar hover styles
                        "highlightStyle": {
                            "fill": "#027d02",
                            "stroke": "black",
                            "strokeWidth": 1,
                        },
                        # Labels on bars
                        "label": {
                            "enabled": True,
                            "color": "#ffffff",  # text color
                            "fontSize": 12,
                            "placement": "insideEnd",
                        },
                        # "fill": {"function": "dagfuncs.sparklineColorFormatter"},
                    },
                },
            }
        )
    return coldefs


column__defs = [
    {"field": "Name"},
    {"field": "Category"},
] + get__value__bars__coldef(list__of__cols=["column1", "column2", "column3"], df=df)


app.layout = html.Div(
    [
        dag.AgGrid(
            rowData=df.to_dict("records"),
            columnDefs=column__defs,
            enableEnterpriseModules=True,
        )
    ]
)

if __name__ == "__main__":
    app.run(debug=True)

Hi @Shail-Shukla
Thank you for your message.Given that you are on Dash Enterprise, can you please create a ticket for the support team?

Hello @Shail-Shukla,

You can achieve this by utilizing the itemStyler

Notice how they made this a function.

We dont currently have access to the itemStyler to pass a function, but here is a working example:

import dash_ag_grid as dag
from dash import Dash, html, Input, Output
import pandas as pd

app = Dash(__name__)
df = pd.DataFrame(
    {
        "Name": ["A", "B", "C"],
        "Category": ["A1", "B3", "C4"],
        "column1": [10, 6, 9],
        "column2": [0.6, 0.13, 0.4],
        "column3": [19, 7, 15],
    }
)
sla__vals = {"column1": 7, "column2": 0.5, "column3": 15}


def get__value__bars__coldef(list__of__cols, df):
    coldefs = []
    for col in list__of__cols:
        df[f"{col}__lst"] = [[v] for v in df[col]]
        mv = df[col].max()
        av = df[col].mean()
        coldefs.append(
            {
                "field": f"{col}__lst",
                "cellRenderer": "agSparklineCellRenderer",
                "cellRendererParams": {
                    "valueCompare": av,
                    "sparklineOptions": {
                        "type": "bar",
                        "direction": "horizontal",
                        "valueAxisDomain": [
                            0,
                            mv,
                        ],  # force scaling across rows
                        # bar hover styles
                        "highlightStyle": {
                            "fill": "#027d02",
                            "stroke": "black",
                            "strokeWidth": 1,
                        },
                        # Labels on bars
                        "label": {
                            "enabled": True,
                            "color": "#ffffff",  # text color
                            "fontSize": 12,
                        },
                    },
                },
            }
        )
    return coldefs


column__defs = [
    {"field": "Name"},
    {"field": "Category"},
] + get__value__bars__coldef(list__of__cols=["column1", "column2", "column3"], df=df)


app.layout = html.Div(
    [
        dag.AgGrid(
            rowData=df.to_dict("records"),
            id="grid",
            columnDefs=column__defs,
            enableEnterpriseModules=True,
        )
    ]
)

app.clientside_callback(
    """
    (id) => {
        function itemStyler(params, value) {
          const { yValue } = params;
          return {
            fill: yValue < value ? "red" : "green",
          };
        }
        window.dash_ag_grid.getApiAsync(id).then((gridApi) => {
            const columns = gridApi.getColumnDefs();
            columns.forEach((col) => {
                if (col.field && col.field.endsWith('__lst')) {
                    col.cellRendererParams.sparklineOptions.itemStyler = (params) => {
                        return itemStyler(params, col.cellRendererParams.valueCompare)
                    };
                }
            })
            gridApi.setGridOption("columnDefs", columns);
            gridApi.redrawRows();
        })
        return window.dash_clientside.no_update;
    }
    """,
    Output("grid", "id"),
    Input("grid", "id"),
)

if __name__ == "__main__":
    app.run(debug=True)
1 Like