Is there a way to specify the color for each section on each level of a sunburst plot?
(I’m very new to this)
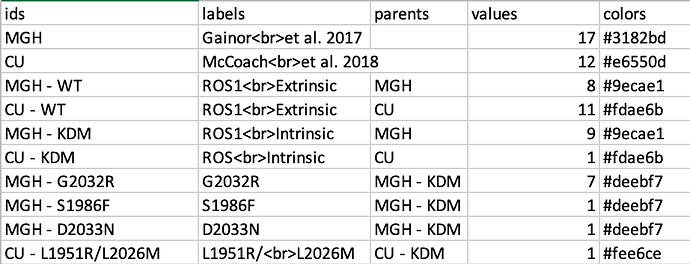
This is my csv.
This is my current code.
library(plotly)
clin2 <- read.csv(“clin_equal.csv”)
ax <- list(
title = “”,
zeroline = FALSE,
showline = FALSE,
showticklabels = FALSE,
showgrid = FALSE
)
clin2_plot <- plot_ly(clin2, ids = ~ids, labels = ~labels, parents = ~parents,
values = ~values, type = ‘sunburst’, branchvalues = ‘total’,
marker = list(colors = clin2$colors)
)
clin2_plot
This is the current plot.
Ideally I want to color such that Intrinsic and Extrinsic are the same color in each half and then move out from there in gradient, but I can’t seem to get it to do what I want. I’d obviously have to change the colors column, but even right now they aren’t the specified color.

