Hi everyone,
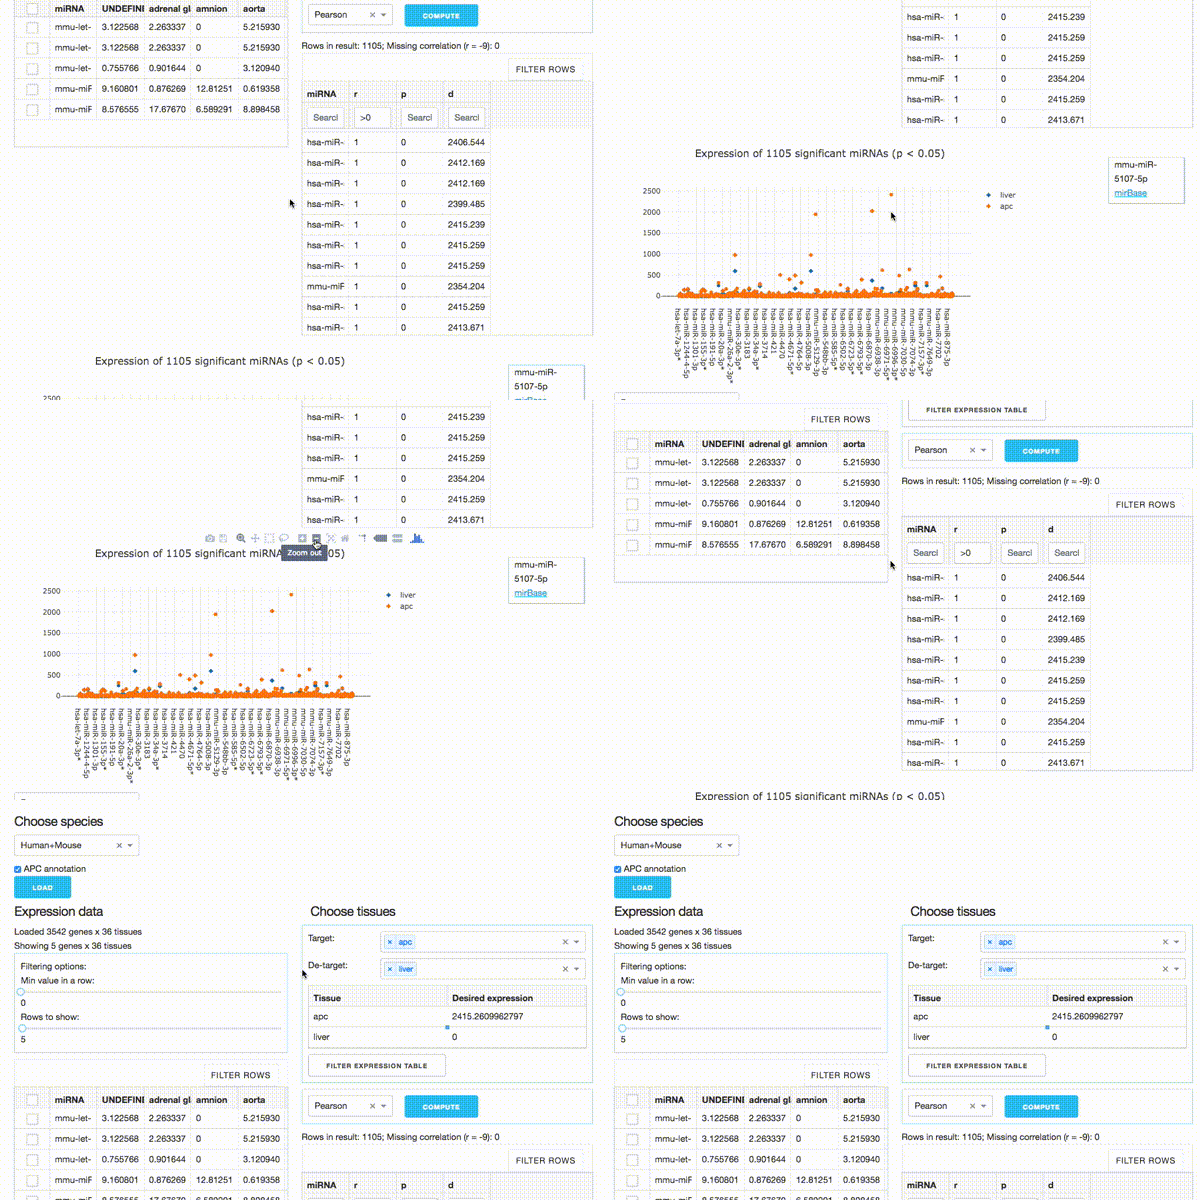
I’ve looked around the forum, but I can’t seem to find a previous post about this. I have a dashboard (part of a multi-page dash app) that generates a Graph at the bottom of the page. There is a good amount of table display and selectors for calculations above it, so you end up having to scroll down to see the Graph. However, when I click on the graph to say, zoom out/in, it does it, but scrolls to the top of the page. Is this expected? From a usability standpoint, this doesn’t work out all that well.
Thanks,
Chris
