Hi all,
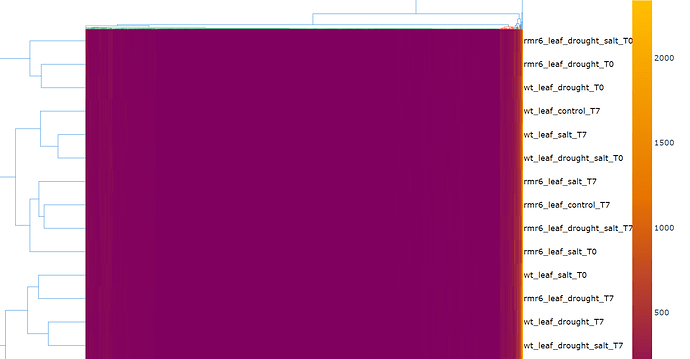
I want to set the zmin and zmax in dashbio clustergram python as we can do it for the plotly heatmap,but I dont see any option to do so. Please find attached the clustergram plotted. You can see that most of the plot is of one color due to the range of the color scale therefore,I want to limit it by setting zmin and zmax. Kindly assist me in this.
Thankyou!
