I added a distplot with multiple labels, when loading the page all labels are plottet. I would like to just get one of the lables plotettd and after that the user can select ofther data.
I tried to fix it with hiddenlabels but that does not work. If anyone has an idea how to solve this I would be very thankful for your help
To be able to suggest how to display only some labels, please be more precise and tell us (or upload an image) what labels are you referring to: ticklabels, text displayed explicitly on the plot or at the hover over the plot.
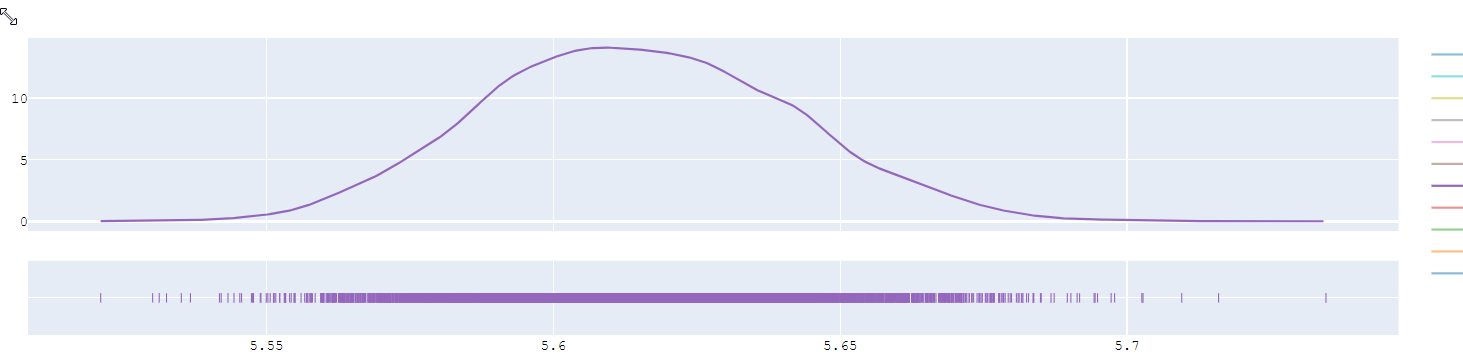
this is what the plot looks like when I load the page. I would just like to see 1 graph instead.
So there should be 1 preselected item and the other ones should be desellected.
I posted here https://chart-studio.plot.ly/~empet/15508 an example and explained how to set trace visibility. Any combination of True, False is permitted in the list visible. Hence following this example you should adapt the button definitions to your particular number of data groups.
thank you for your response, that really helped alot
Do you know if there is a possibility to solve this Problem without a dropdown? For example if I select all groups on the Dropdown from your example I can also just show one plot by klicking on the icon on the legend. I would like to have just 1 item selected when loading the page and then the user can select which kind of data he wants to see by klicking on the legend.
Do you also have an idea for this? (in Bootstrap there is a way to just say which group should be selected first, kind like this )
If there is no way to solve the Problem like this a dropdown would work as well.
With ploty.py all you can get in this direction is to set the legend property, itemclick or 'itemdoubleclick on 'toggle' or 'toggleothers'.
From:
help(go.layout.Legend)
we learn that:
itemclick
 |          Determines the behavior on legend item click. "toggle"
 |          toggles the visibility of the item clicked on the
 |          graph. "toggleothers" makes the clicked item the sole
 |          visible item on the graph. False disable legend item
 |          click interactions.
 |      itemdoubleclick
 |          Determines the behavior on legend item double-click.
 |          "toggle" toggles the visibility of the item clicked on
 |          the graph. "toggleothers" makes the clicked item the
 |          sole visible item on the graph. False disable legend
 |          item double-click interactions.
Hence, after defining a distplot from two data groups, that displays histograms, the pdf estimations and the rug plots:
import plotly.figure_factory as ff
import numpy as np

x1 = np.random.randn(200) - 2
x2 = np.random.randn(200) + 3.7

# Group data
hist_data = [x1,  x2]
group_labels = ['Group 1', 'Group 2']

# Create distplot with custom bin_size
fig = ff.create_distplot(hist_data, group_labels, bin_size=.2)
for k in [2,3,4,5]:
    fig.data[k].update(showlegend=True)
fig.update_layout(legend_traceorder='normal',
                  legend_itemclick='toggleothers'#or 'toggle'
                 )
we have to ensure that each trace is mapped to the legend. By default only the histograms are represented in legend. Hence we perform the other traces uodate, as follows:
for k in [2,3,4,5]:
    fig.data[k].update(showlegend=True)