Hi everyone;
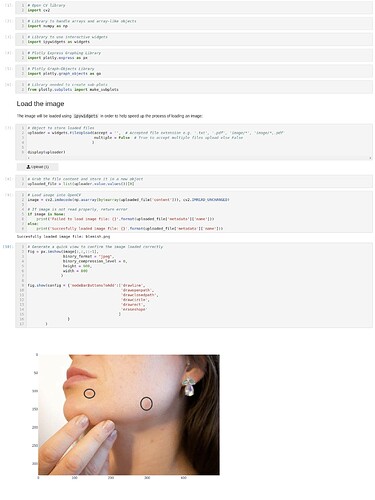
This is my code for how I’m using ipywidgets and plotly together in image analytics.
Does someone know how I can capture the mouse coordinates related to the two circles that I’ve annotated on this image? I know there must be some sort of callback, but it’s not clear to me what it’ll be. The callbacks I’ve seen on the plotly samples are for a scatter plot, I haven’t see the same references when using px.imshow().
When I hover over the image, it tells me the mouse coordinates and RGB color values so I know there must be some sort of interaction there.
Could someone please tell me how it’s done so I can capture these mouse coordinates?
Also, I’m not interested in using Dash. My goal is not to create an app or dash-board. My goal is to figure things out first in jupyter, and OpenCV, before migrating everything over to Dash.
In other words, Dash is not fit for purpose. I’m not ready to create an app, I’m still doing research and development.
Can someone please help?
Thank you!
