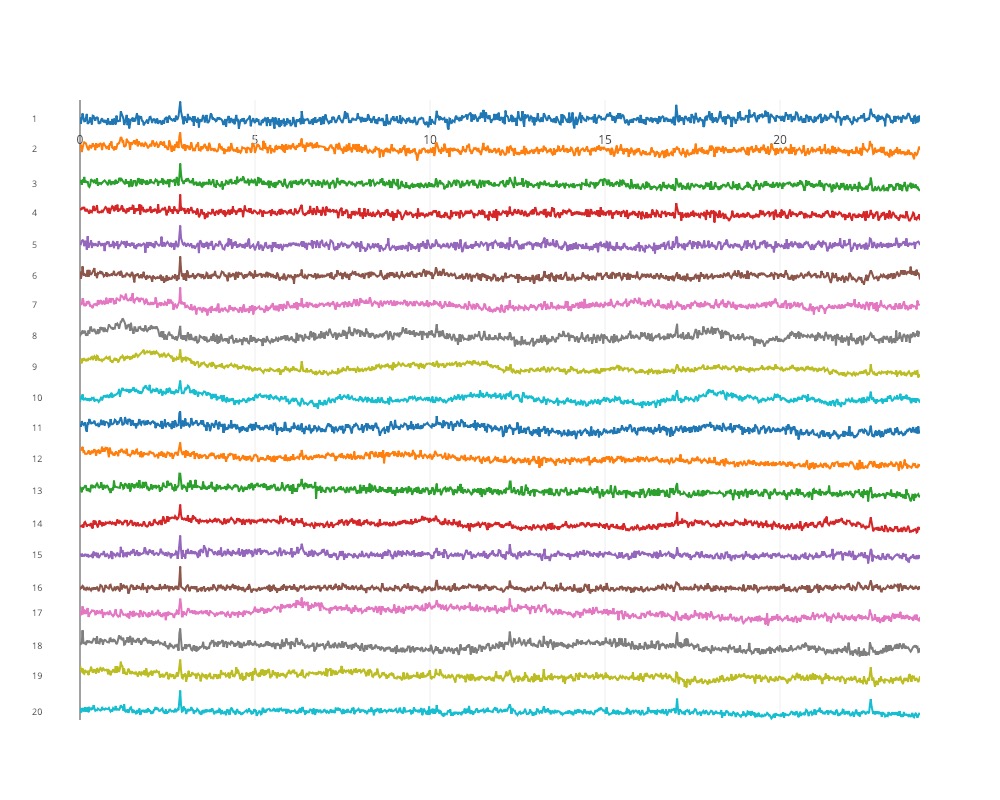
# add channel names using Annotations
annotations = list([Annotation(x=-0.06, y=0, xref='paper', yref='y%d' % (ii + 1),
                                      text=ch_name, font=Font(size=9), showarrow=False)
                          for ii, ch_name in enumerate(ch_names)])

layout.update(annotations=annotations)

# set the size of the figure and plot it
layout.update(autosize=False, width=1000, height=800)
fig = Figure(data=traces, layout=layout)
py.iplot(fig, filename='shared xaxis')
I don’t think I understand what you mean by “expand”. Could you describe the behavior you want, and what you’re seeing?
Also, could you add complete examples of the working and not working behavior? These would include the imports, data, and plotting code so that folks can copy and paste them to reproduce what you’re seeing.
---------------------------------------------------------------------------
NameError                                 Traceback (most recent call last)
<ipython-input-1-a22c6f18c6ef> in <module>
     20 ch_names = [str(i) for i in range(1,n_channels+1)]
     21
---> 22 data = data_orig.transpose()[:n_channels,:]
     23 times = np.array(np.linspace(0,24,990))
     24

NameError: name 'data_orig' is not defined
Thanks for the example @alexyalunin, I see what you mean.
It looks like the zoom stops working when the y axes are spaced to closely together. For example, n_channels=48 works if I set the figure height to 1800.
Would it work for you to place all of these lines on the same axes, applying a constant y offset to each line?