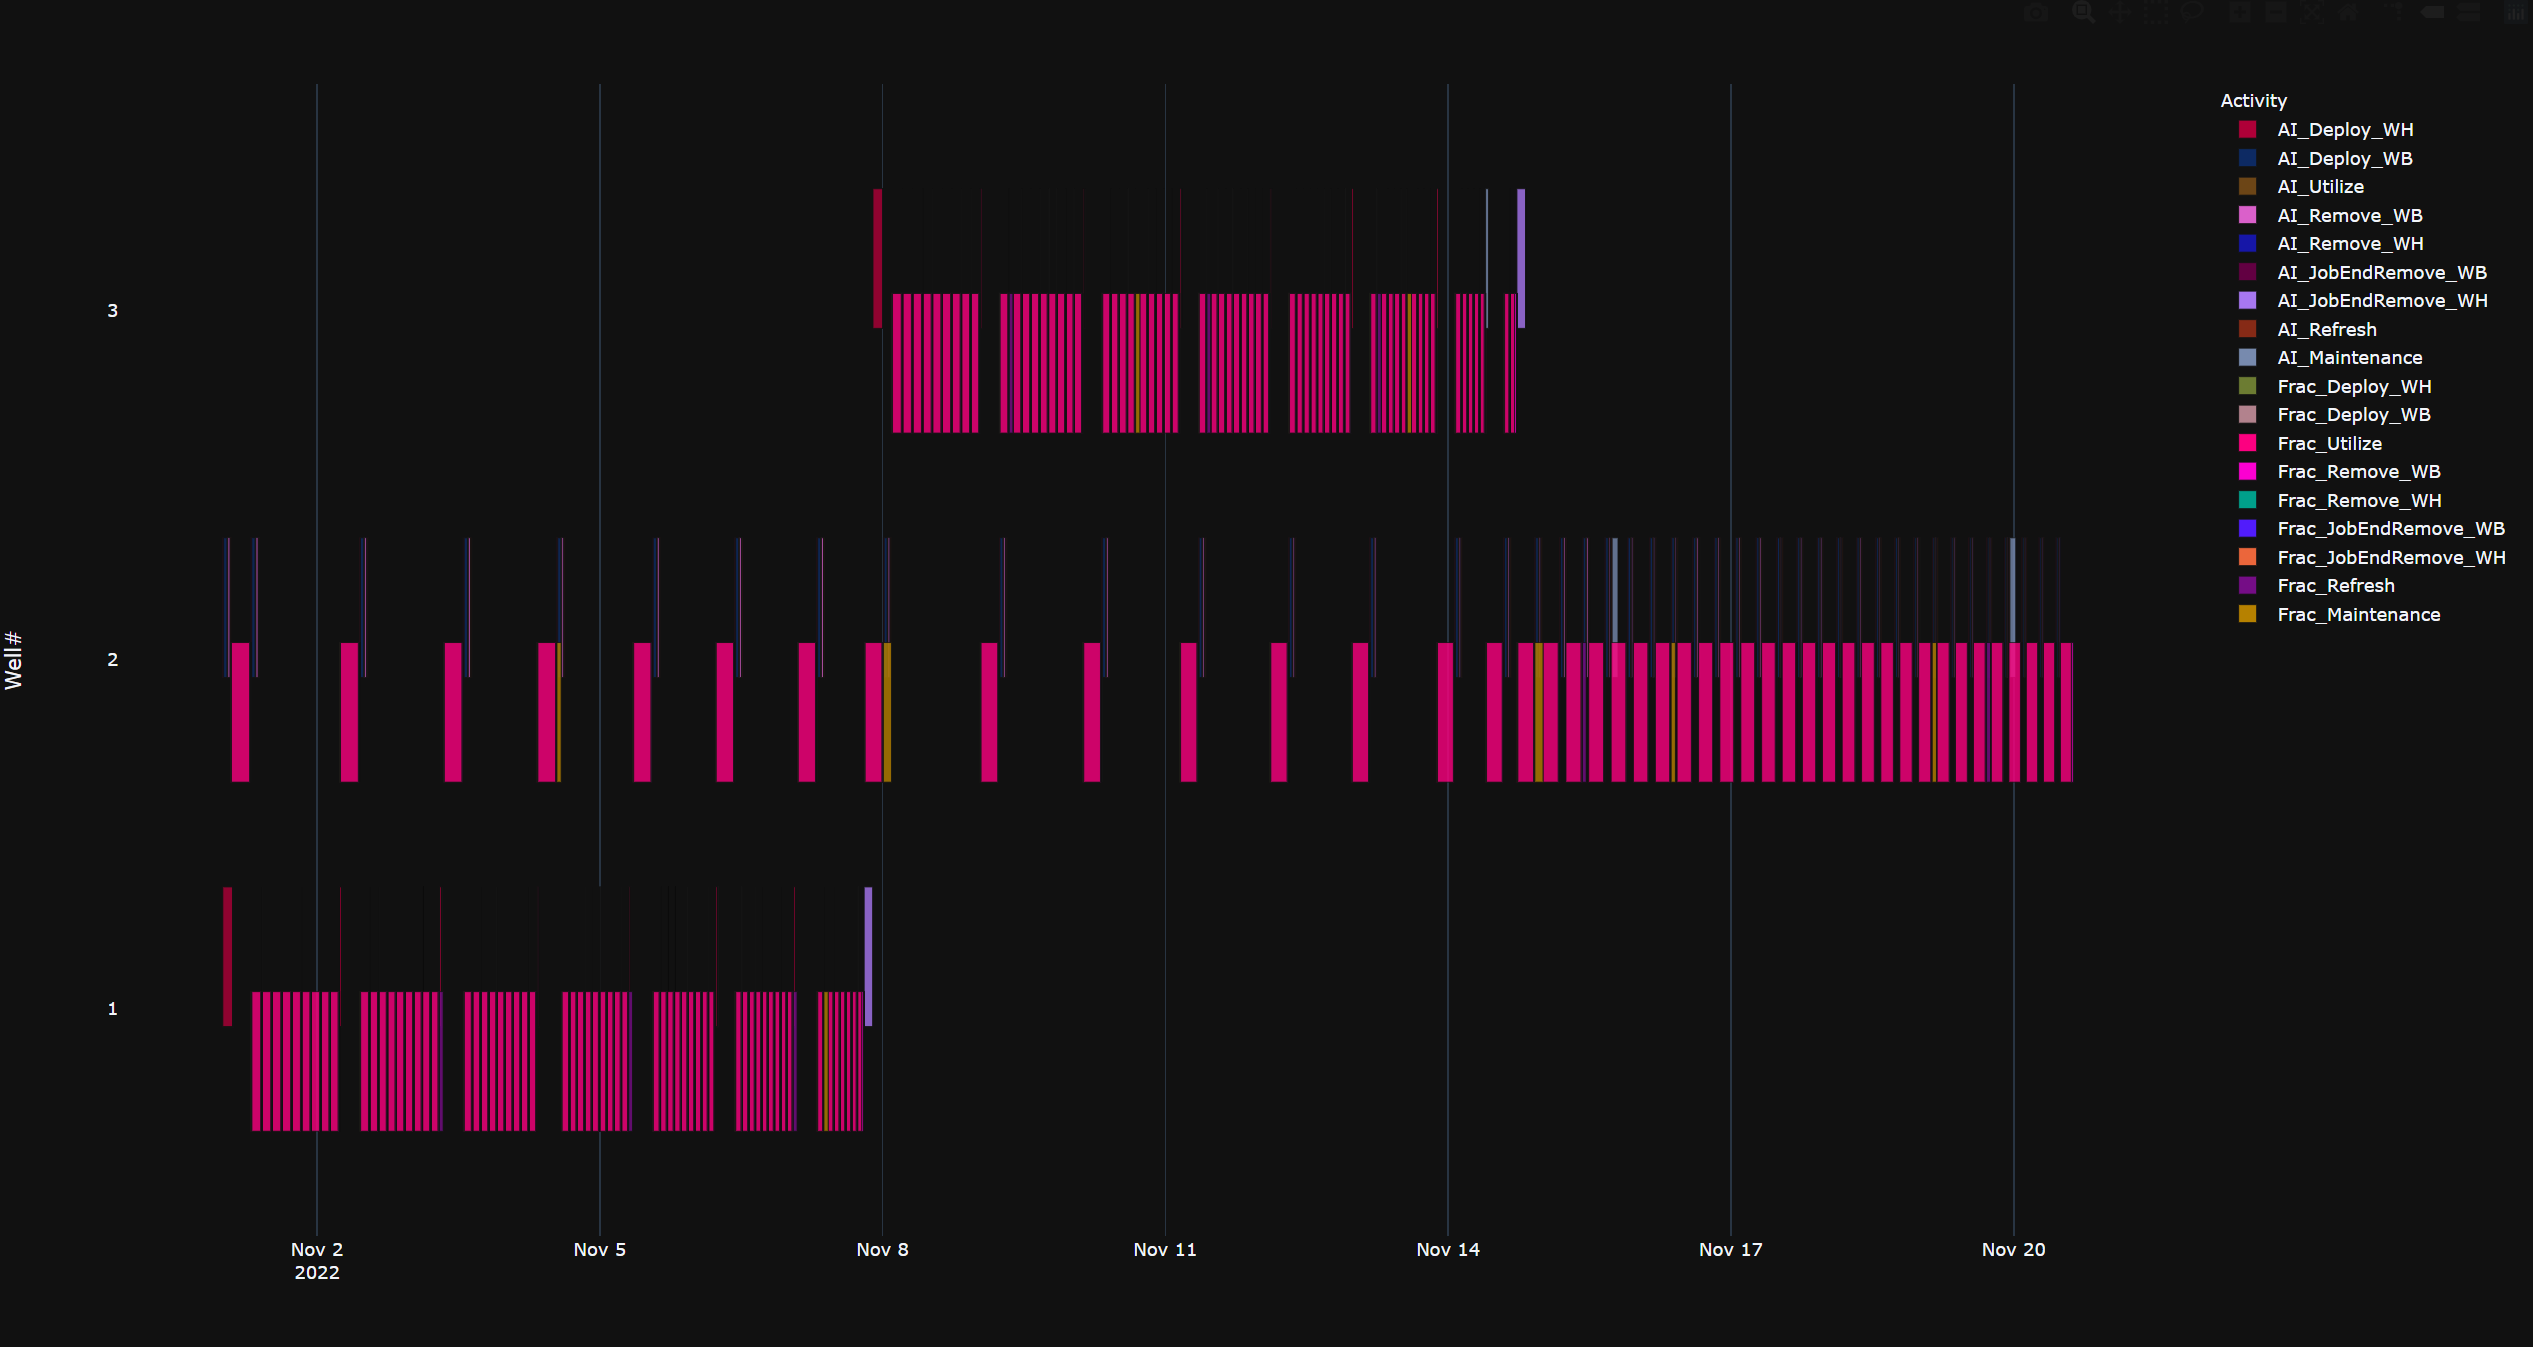
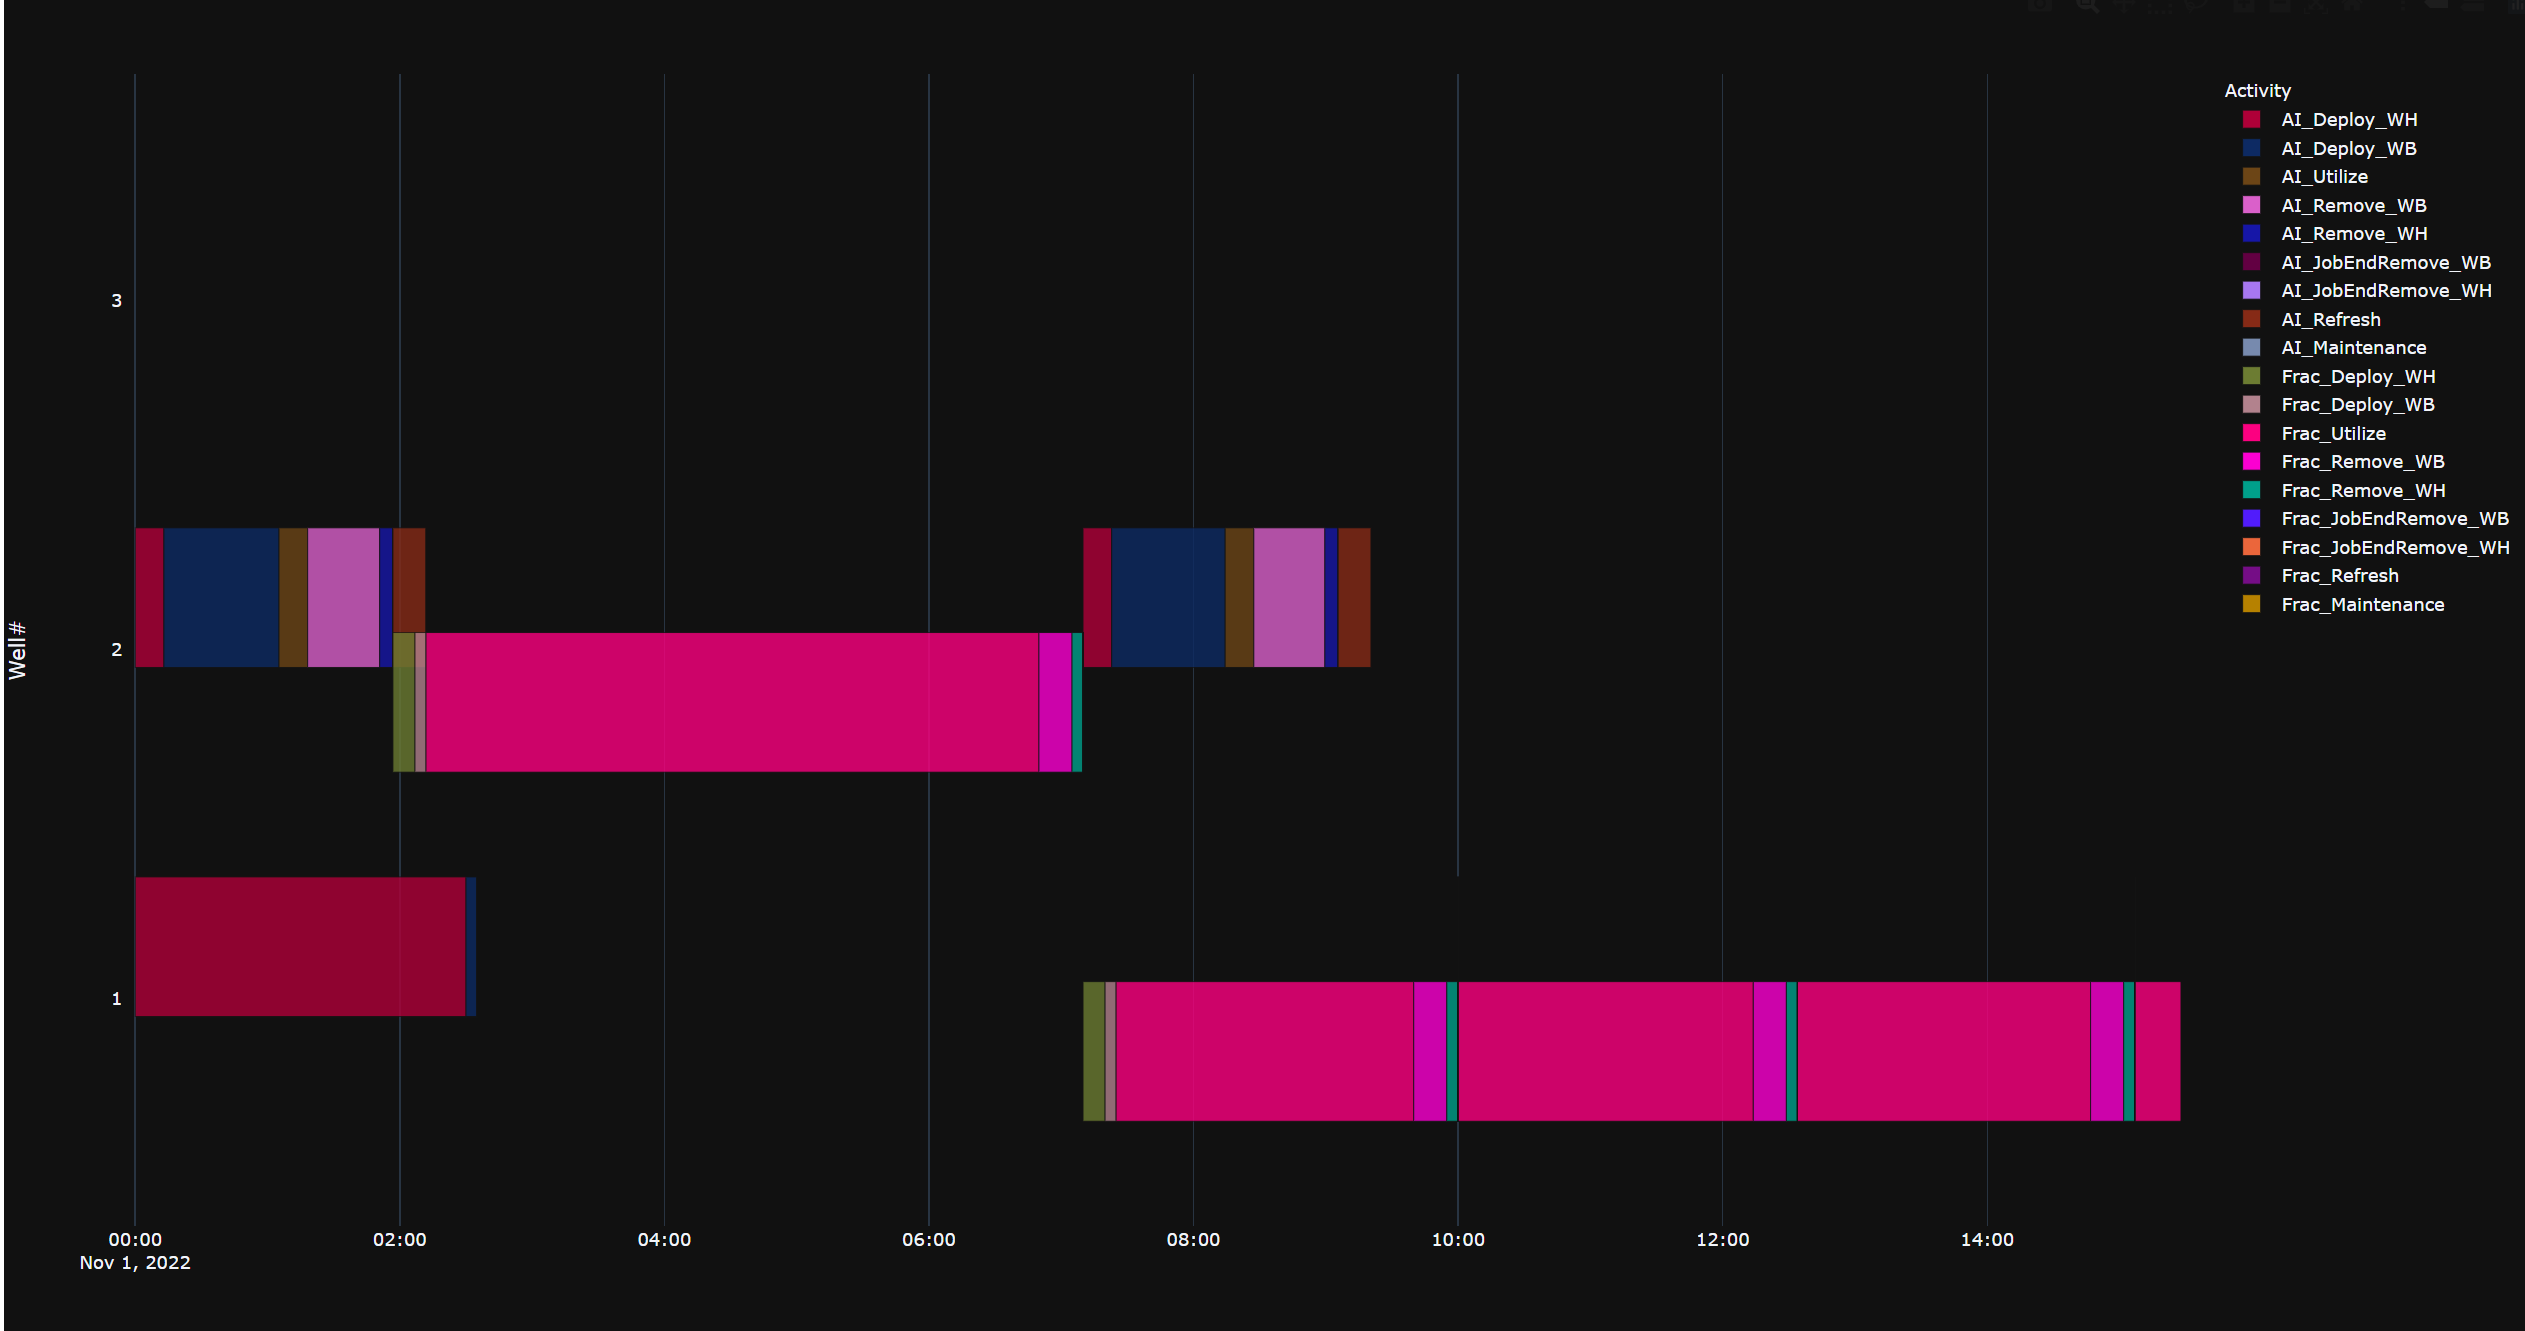
I have create a gannt chart a few different ways: thick lines, filled areas, and, what seems to work best, is a timeline plot. It seems this number of traces is considered a large amount by plotly (zooming, etc is not smooth).
fig = px.timeline(dfGannt,
                      x_start="Start",
                      x_end="Stop",
                      y="Well#",
                      color="Activity",
                      opacity=0.8,
                      )
    fig.update_traces(width=0.5)
    fig.update_yaxes(tickformat =',d')
The problem I’m consistently having is the plot area (the axes) not filling the figure area. Typically, as I zoom, the figure moves increasingly to just the bottom-right corner of the browser window.
Starts sometimes like this

After two zooms:
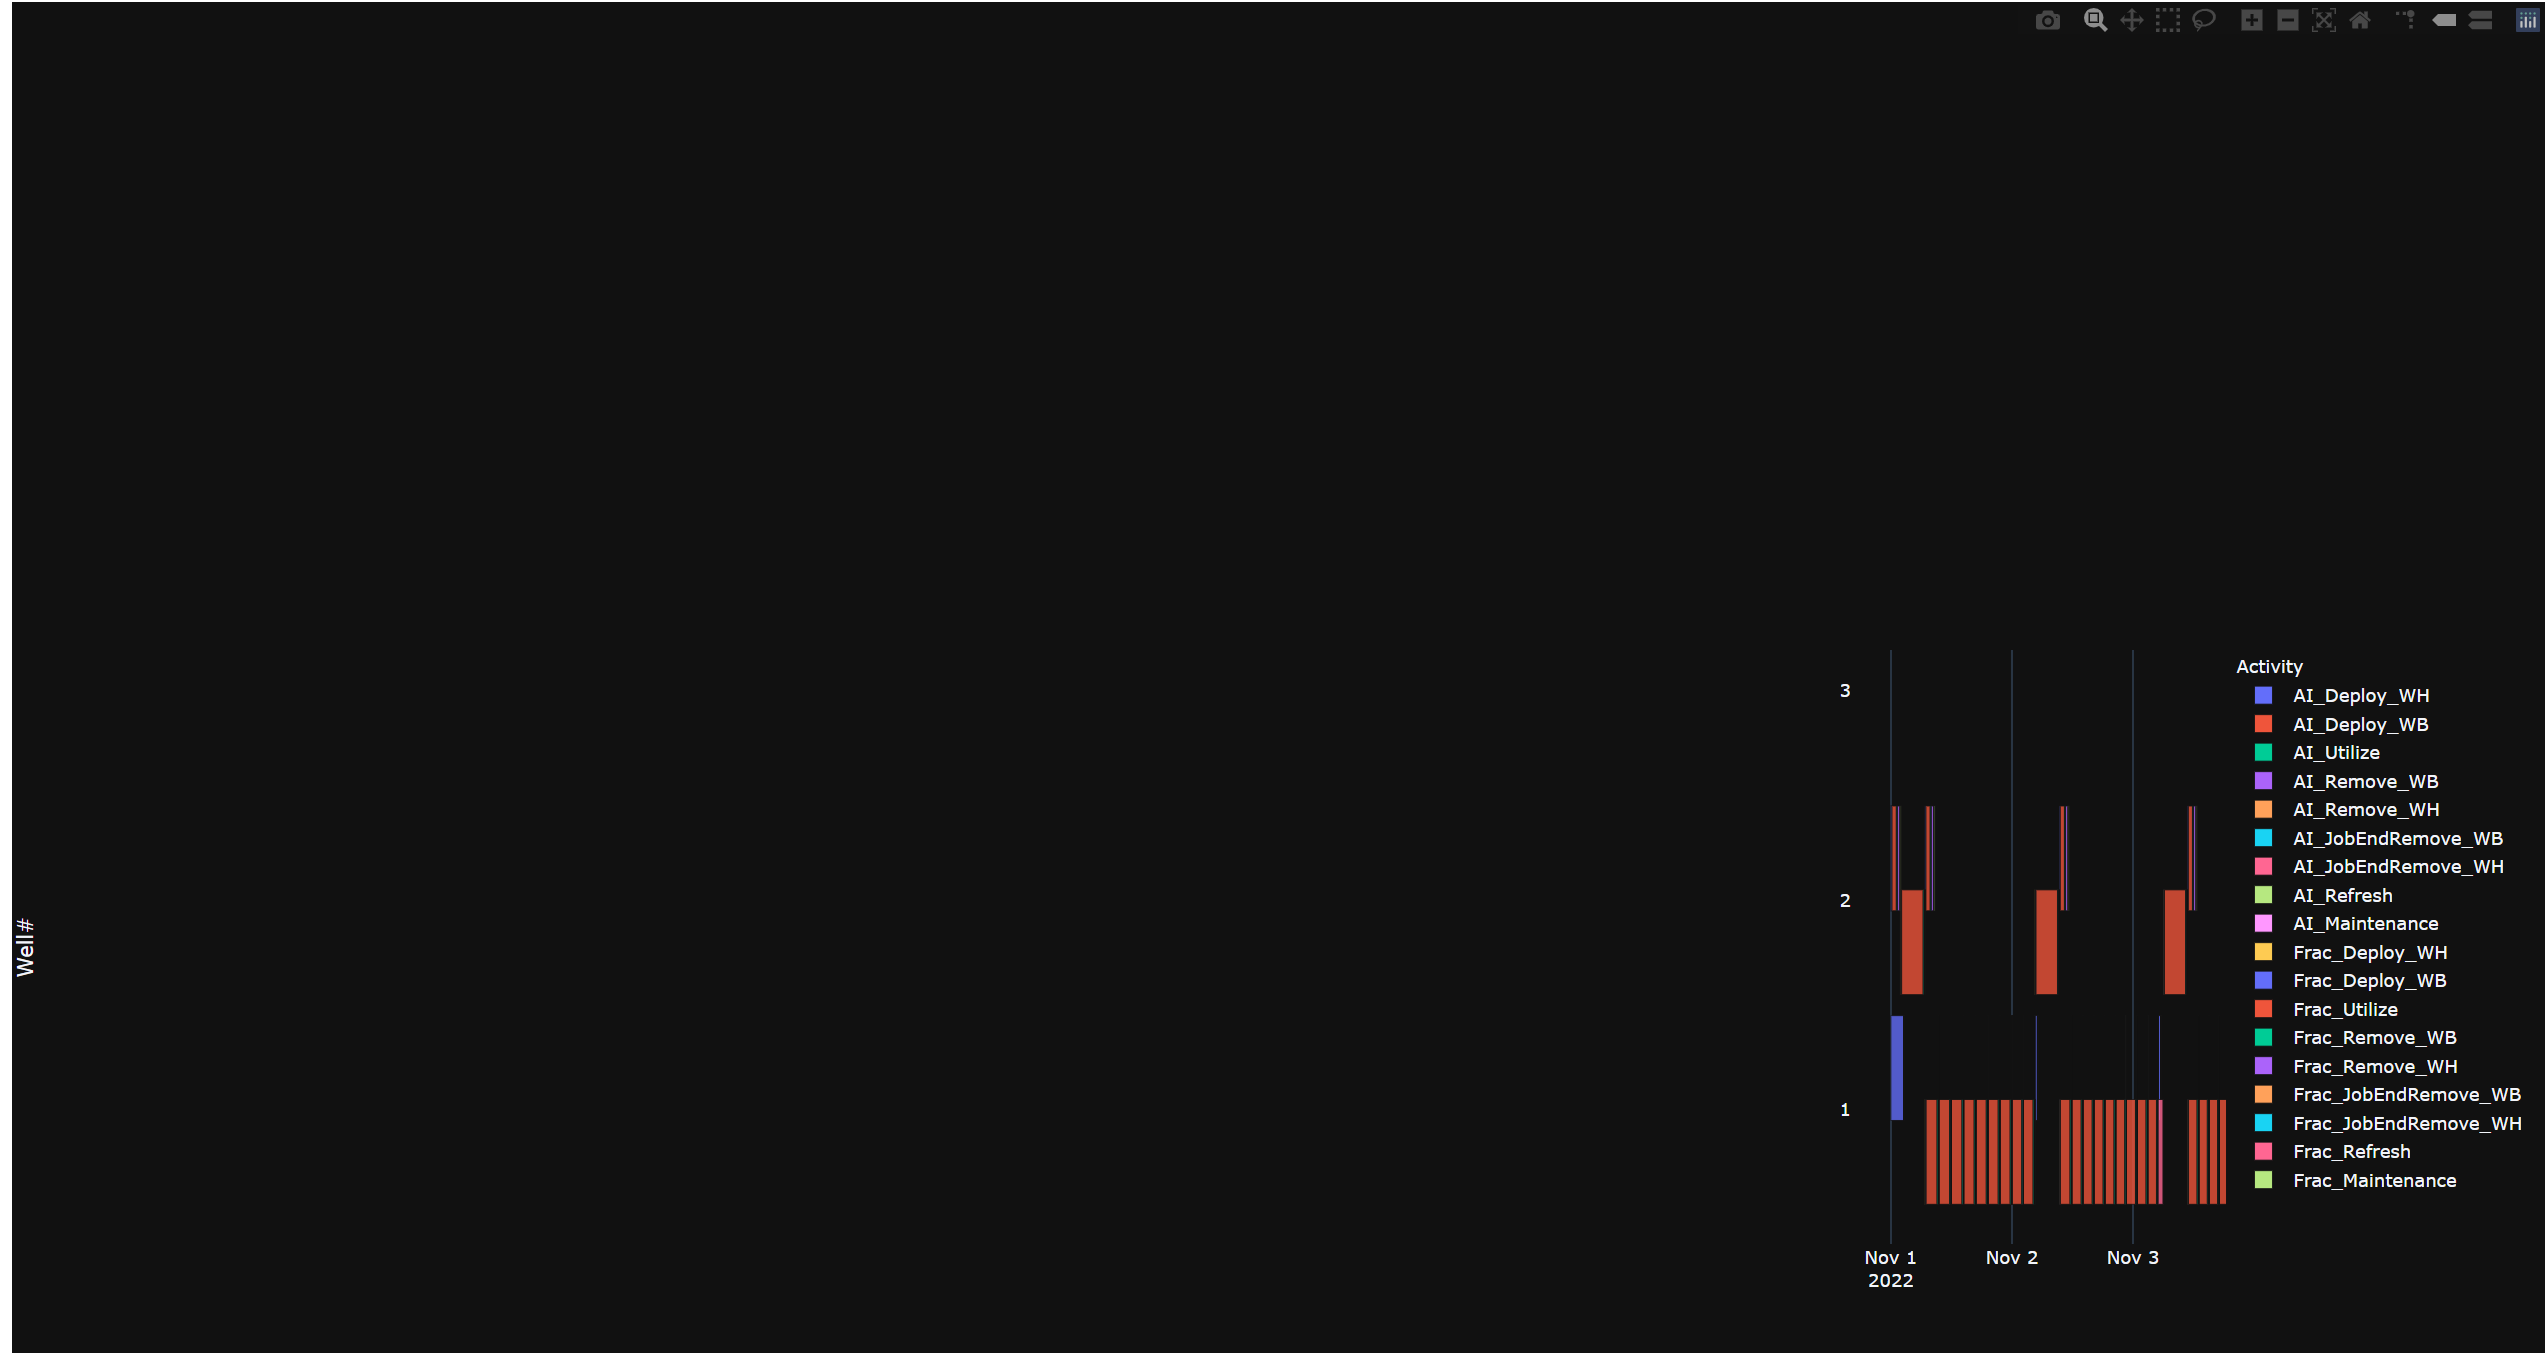
Sometimes clicking “Reset axes” restores to the original size. Other times it does not. I’ve attempted playing with fig.layout.width, fig.layout.autosize, etc. I’ve tried changing renderers.
Anyone have any suggestions? What properties should I be playing with?