Short answer:
yes, your example works fine with plotly 4.5.5 installed from GitHub.
The “installed by default” plotly v. 4.5.2 does not work.
Thanks!
Dmitry
A bit longer answer:
# just reinstalling plotly to double check which version I would end up with (answer: still brings plotly v. 4.5.2):
remove.packages(“plotly”)
Removing package from ‘/Library/Frameworks/R.framework/Versions/3.3/Resources/library’
(as ‘lib’ is unspecified)
install.packages(“plotly”)
trying URL ‘https://cran.rstudio.com/bin/macosx/mavericks/contrib/3.3/plotly_4.5.2.tgz’
Content type ‘application/x-gzip’ length 806762 bytes (787 KB)
==================================================
downloaded 787 KB
# Installing plotly from github
uninstall plottly
remove.packages(“plotly”)
install package “devtools”, so we can install latest plotly from github
install.packages(“devtools”)
library(devtools)
install plotly package from github
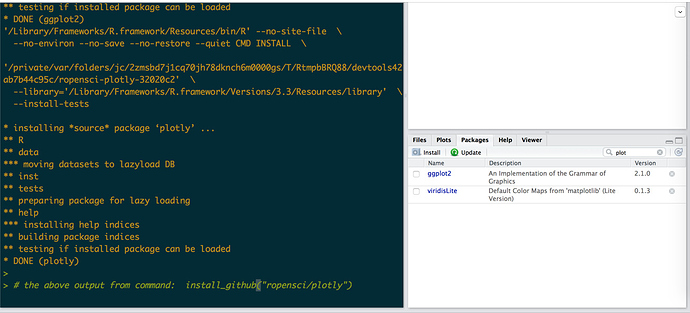
install_github(“ropensci/plotly”)
surprisingly installation went well, but no “plotly” package listed under “Packages” tab:
# but RStudio seems able to load (and autocomplete works for package name plotly):
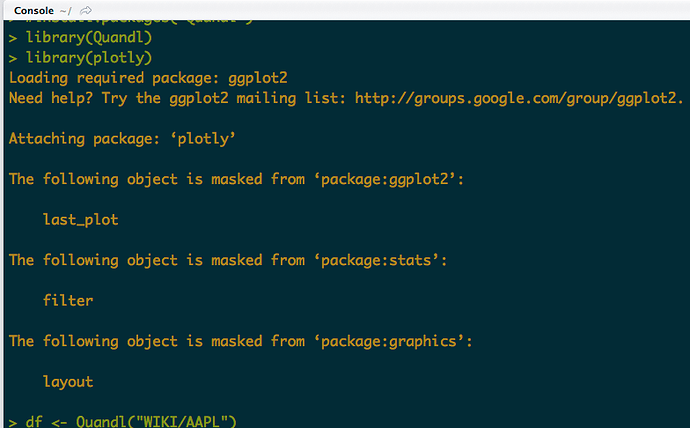
library(plotly)
Loading required package: ggplot2
Attaching package: ‘plotly’
The following object is masked from ‘package:ggplot2’:
last_plot
The following object is masked from ‘package:stats’:
filter
The following object is masked from ‘package:graphics’:
layout
# and even though not listed among “Packages” tab, we can see it is actually loaded:
(.packages())
[1] “Quandl” “xts” “zoo” “plotly” “ggplot2” “devtools”
[7] “stats” “graphics” “grDevices” “utils” “datasets” “methods”
[13] “base”
# funny that the installation and loading the plotly from github didn’t mention the version anywhere!
install_github(“ropensci/plotly”)
Downloading GitHub repo ropensci/plotly@master
from URL h_t_tps://api.github.com/repos/ropensci/plotly/zipball/master
Installing plotly
Downloading GitHub repo hadley/ggplot2@master
from URL h_t_tps://api.github.com/repos/hadley/ggplot2/zipball/master
Installing ggplot2
trying URL ‘h_t_tps://cran.rstudio.com/bin/macosx/mavericks/contrib/3.3/reshape2_1.4.2.tgz’
Content type ‘application/x-gzip’ length 202343 bytes (197 KB)
==================================================
downloaded 197 KB
Installing reshape2
‘/Library/Frameworks/R.framework/Resources/bin/R’ --no-site-file
–no-environ --no-save --no-restore --quiet CMD INSTALL
‘/private/var/folders/jc/2zmsbd7j1cq70jh78dknch6m0000gs/T/RtmpbBRQ88/devtools42ab445b4dd7/reshape2’
–library=‘/Library/Frameworks/R.framework/Versions/3.3/Resources/library’
–install-tests
-
installing binary package ‘reshape2’ …
-
DONE (reshape2)
Downloading GitHub repo hadley/scales@master
from URL h_t_tps://api.github.com/repos/hadley/scales/zipball/master
Installing scales
‘/Library/Frameworks/R.framework/Resources/bin/R’ --no-site-file
–no-environ --no-save --no-restore --quiet CMD INSTALL
‘/private/var/folders/jc/2zmsbd7j1cq70jh78dknch6m0000gs/T/RtmpbBRQ88/devtools42ab2194467c/hadley-scales-d58d83a’
–library=‘/Library/Frameworks/R.framework/Versions/3.3/Resources/library’
–install-tests
-
installing source package ‘scales’ …
** libs
clang++ -I/Library/Frameworks/R.framework/Resources/include -DNDEBUG -I/usr/local/include -I/usr/local/include/freetype2 -I/opt/X11/include -I"/Library/Frameworks/R.framework/Versions/3.3/Resources/library/Rcpp/include" -fPIC -Wall -mtune=core2 -g -O2 -c RcppExports.cpp -o RcppExports.o
clang++ -I/Library/Frameworks/R.framework/Resources/include -DNDEBUG -I/usr/local/include -I/usr/local/include/freetype2 -I/opt/X11/include -I"/Library/Frameworks/R.framework/Versions/3.3/Resources/library/Rcpp/include" -fPIC -Wall -mtune=core2 -g -O2 -c colors.cpp -o colors.o
clang++ -dynamiclib -Wl,-headerpad_max_install_names -undefined dynamic_lookup -single_module -multiply_defined suppress -L/Library/Frameworks/R.framework/Resources/lib -L/usr/local/lib -o scales.so RcppExports.o colors.o -F/Library/Frameworks/R.framework/… -framework R -Wl,-framework -Wl,CoreFoundation
installing to /Library/Frameworks/R.framework/Versions/3.3/Resources/library/scales/libs
** R
** tests
** preparing package for lazy loading
** help
Loading required package: scales
*** installing help indices
** building package indices
** testing if installed package can be loaded
-
DONE (scales)
‘/Library/Frameworks/R.framework/Resources/bin/R’ --no-site-file
–no-environ --no-save --no-restore --quiet CMD INSTALL
‘/private/var/folders/jc/2zmsbd7j1cq70jh78dknch6m0000gs/T/RtmpbBRQ88/devtools42ab614edf51/hadley-ggplot2-cd6a691’
–library=‘/Library/Frameworks/R.framework/Versions/3.3/Resources/library’
–install-tests
-
installing source package ‘ggplot2’ …
** R
** data
*** moving datasets to lazyload DB
** inst
** tests
** preparing package for lazy loading
** help
*** installing help indices
** building package indices
** installing vignettes
** testing if installed package can be loaded
-
DONE (ggplot2)
‘/Library/Frameworks/R.framework/Resources/bin/R’ --no-site-file
–no-environ --no-save --no-restore --quiet CMD INSTALL
‘/private/var/folders/jc/2zmsbd7j1cq70jh78dknch6m0000gs/T/RtmpbBRQ88/devtools42ab7b44c95c/ropensci-plotly-32020c2’
–library=‘/Library/Frameworks/R.framework/Versions/3.3/Resources/library’
–install-tests
-
installing source package ‘plotly’ …
** R
** data
*** moving datasets to lazyload DB
** inst
** tests
** preparing package for lazy loading
** help
*** installing help indices
** building package indices
** testing if installed package can be loaded
-
DONE (plotly)
library(plotly)
Loading required package: ggplot2
Attaching package: ‘plotly’
The following object is masked from ‘package:ggplot2’:
last_plot
The following object is masked from ‘package:stats’:
filter
The following object is masked from ‘package:graphics’:
layout
# the only way (I found) to see the version of loaded plotly (which happen to be 4.5.5.9000):
sessionInfo()
attached base packages:
[1] stats graphics grDevices utils datasets methods base
other attached packages:
[1] Quandl_2.8.0 xts_0.9-7 zoo_1.7-13
[4] plotly_4.5.5.9000 ggplot2_2.1.0.9001 devtools_1.12.0
loaded via a namespace (and not attached):
[1] Rcpp_0.12.7 knitr_1.14 magrittr_1.5 munsell_0.4.3
[5] lattice_0.20-33 viridisLite_0.1.3 colorspace_1.2-7 R6_2.2.0
[9] httr_1.2.1 plyr_1.8.4 dplyr_0.5.0 tools_3.3.1
[13] grid_3.3.1 gtable_0.2.0 DBI_0.5-1 git2r_0.15.0
[17] withr_1.0.2 htmltools_0.3.5 yaml_2.1.13 lazyeval_0.2.0
[21] digest_0.6.10 assertthat_0.1 tibble_1.2 tidyr_0.6.0
[25] purrr_0.2.2 base64enc_0.1-3 htmlwidgets_0.7 curl_2.1
[29] memoise_1.0.0 scales_0.4.0.9003 jsonlite_1.1
(I’ll paste code here for completeness)
library(Quandl)
library(plotly)
df ← Quandl(“WIKI/AAPL”)
df ← df[,c(1, 9:12)]
names(df) ← c(“Date”, “Open”, “High”, “Low”, “Close”)
df$Date ← as.Date(df$Date)
df ← df[1:1000,]
hovertxt ← Map(function(x, y)paste0(x, “:”, y), names(df), df)
hovertxt ← Reduce(function(x, y)paste0(x, “<br>”, y), hovertxt)
plot_ly(df, x = ~Date, xend = ~Date, hoverinfo = “none”,
color = ~Close > Open, colors = c(“#00b386”,“#ff6666”)) %>%
add_segments(y = ~Low, yend = ~High, line = list(width = 1, color = “black”)) %>%
add_segments(y = ~Open, yend = ~Close, line = list(width = 3)) %>%
add_markers(y = ~(Low + High)/2, hoverinfo = “text”,
text = hovertxt, marker = list(color = “transparent”)) %>%
layout(showlegend = FALSE,
yaxis = list(title = “Price”, domain = c(0, 0.9)),
annotations = list(
list(xref = “paper”, yref = “paper”,
x = 0, y = 1, showarrow = F,
xanchor = “left”, yanchor = “top”,
align = “left”,
text = paste0(“AAPL”)),
       list(xref = "paper", yref = "paper",
            x = 0.75, y = 1, showarrow = F,
            xanchor = "left", yanchor = "top",
            align = "left",
            text = paste(range(df$Date), collapse = " : "),
            font = list(size = 8))),
     plot_bgcolor = "#f2f2f2")
# worked this time!
Thanks!


