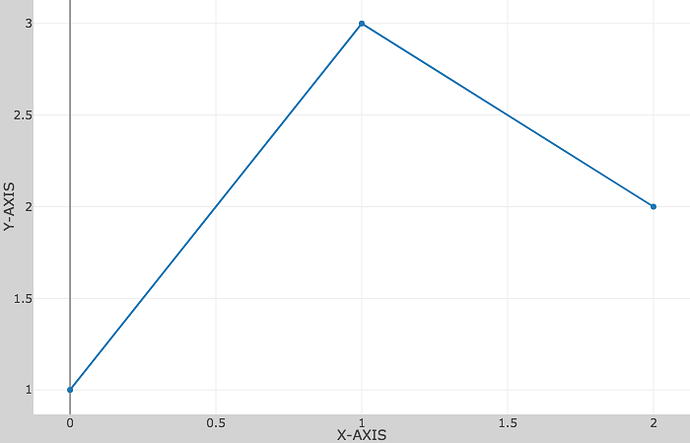
I am trying to save a go.Figure with pio.write_image without a padded “paper background” object, such that the specified (width, height) params represent the box surrounding the (title/plot/axis) elements only. I can use go.Figure.layout.margin to limit the paper size, but I can’t figure out how to keep the y-axis title nicely spaced from the y-axis tick labels (since the tick labels will have value-dependent widths when written horizontally).
Hi @tks,
I think you can use the automargin axis properties to accomplish this. automargin essentially tells plotly.js to start with the margin specified in fig.layout.margin and then expand it if necessary to keep from cutting off text elements.
Here’s an example of setting margins to 0 and enabling automargin.
fig = go.FigureWidget(
    data=[go.Scatter(y=[1, 3, 2])],
    layout={
        'margin': {'l': 0, 'r': 0, 't': 0, 'b': 0},
        'xaxis': {'automargin': True, 'title': 'X-AXIS'},
        'yaxis': {'automargin': True, 'title': 'Y-AXIS'},
        'paper_bgcolor': 'lightgray'
    }
)
fig
Hope that helps!
-Jon
2 Likes
That does it – thanks @jmmease!
1 Like
