Hello!
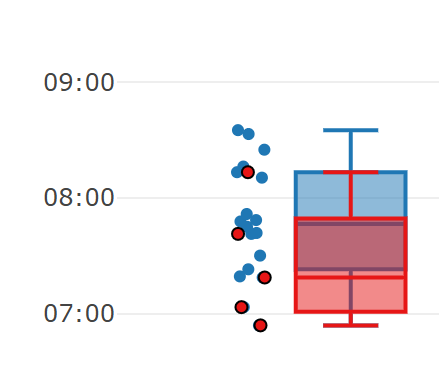
I’m currently making a boxplot graph where I can compare data to each other. With this, some graphs might be overlayed on each other. The goal is to make them with a fairly transparent fill color and a black outline to help distinguish it. Although I am able to get the intended effect with the scatter points, the boxplots themselves are only one color with no distinct outline.
Here is an example of one of my graphs:
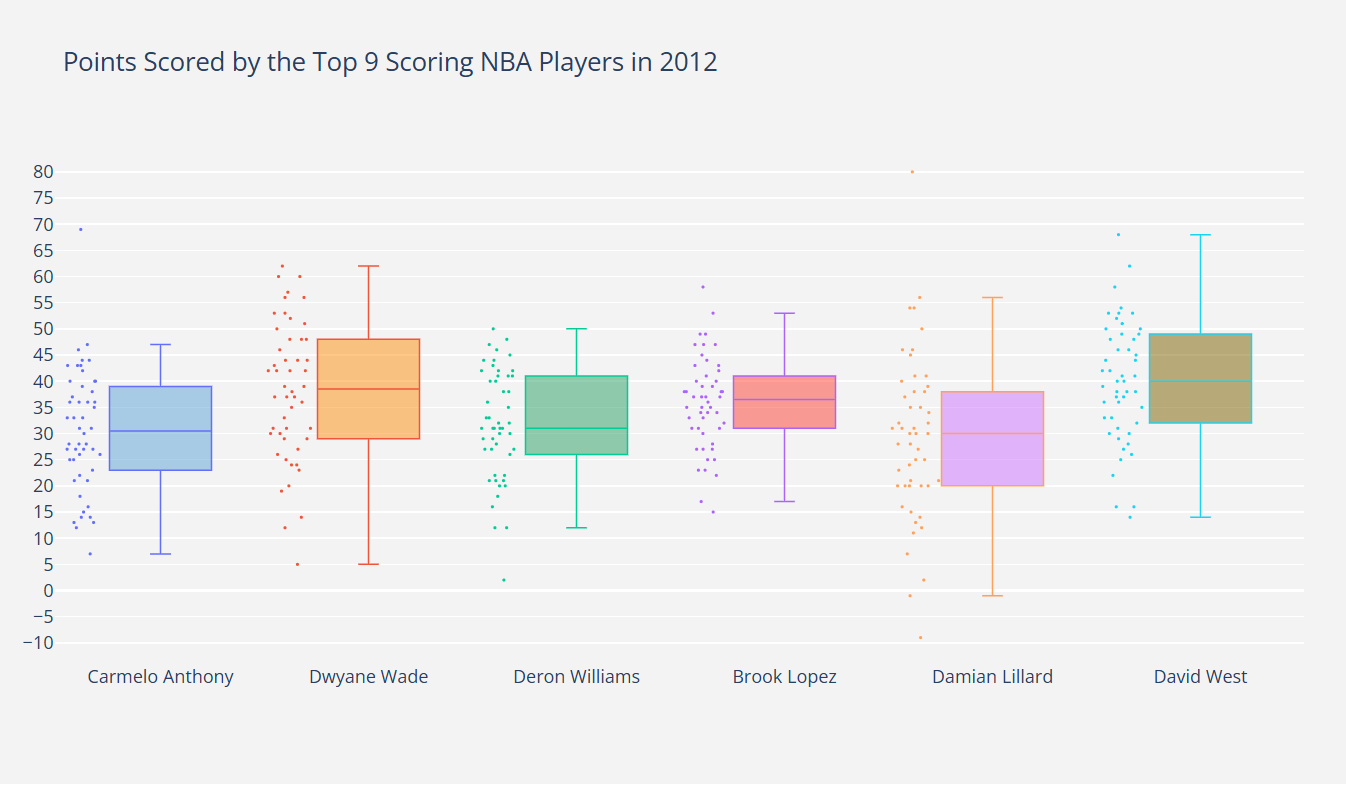
This styling seems to be possible, at least in python as shown in the documentation, although I’m not sure how the styling works in this graph example to get the intended effect. Here is the link and photo that I’m referencing:
If someone could help me translate this to Javascript, that would be great, thank you.