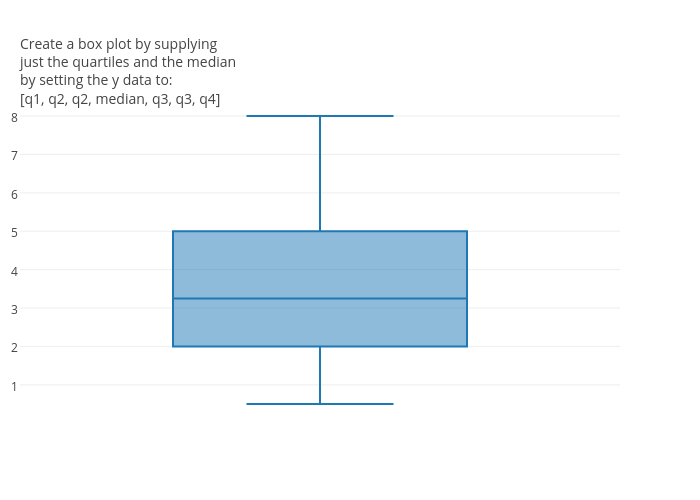
Alternatively, I’m pretty sure that you can create the box plot that you are looking for by just supplying your y data as [q1, q2, q2, median, q3, q3, q4]. Here is an example: https://plot.ly/~chris/18051/.
Alternatively, I’m pretty sure that you can create the box plot that you are looking for by just supplying your y data as [q1, q2, q2, median, q3, q3, q4]. Here is an example: https://plot.ly/~chris/18051/.