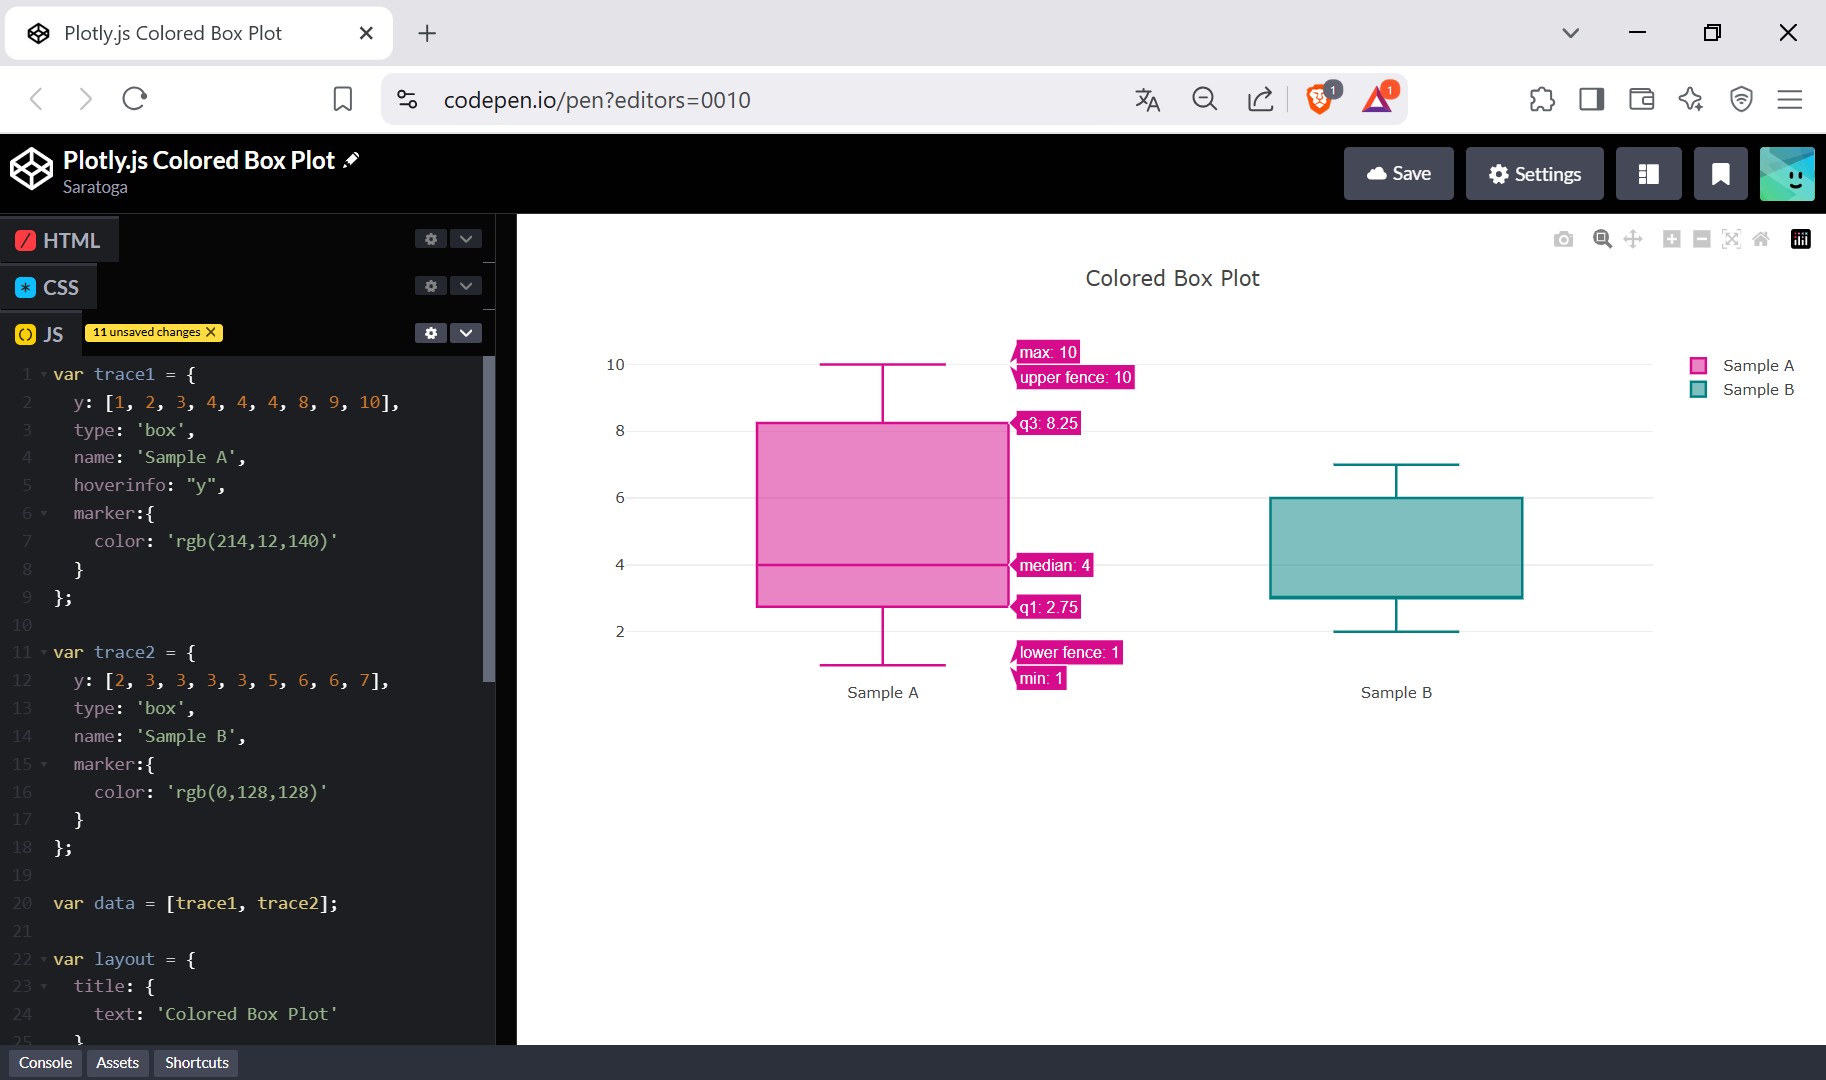
I am using box plot while hover i am getting extra legend information how to avoid this information

yellow highlighted information is related to legend
using hoverText and hoverInfo:text property
I am using box plot while hover i am getting extra legend information how to avoid this information
using hoverText and hoverInfo:text property
data[type=scatter]"" Template string used for rendering the information that appear on hover box. Note that this will override hoverinfo. Variables are inserted using %{variable}, for example “y: %{y}” as well as %{xother}, {%xother}, {%xother}, {%xother}. When showing info for several points, “xother” will be added to those with different x positions from the first point. An underscore before or after “(x|y)other” will add a space on that side, only when this field is shown. Numbers are formatted using d3-format’s syntax %{variable:d3-format}, for example “Price: %{y:$.2f}”. GitHub - d3/d3-format at v1.4.5 for details on the formatting syntax. Dates are formatted using d3-time-format’s syntax %{variable|d3-time-format}, for example “Day: %{2019-01-01|%A}”. GitHub - d3/d3-time-format at v2.2.3 for details on the date formatting syntax. The variables available in hovertemplate are the ones emitted as event data described at this link https://plotly.com/javascript/plotlyjs-events/#event-data. Additionally, every attributes that can be specified per-point (the ones that are arrayOk: true) are available. Anything contained in tag <extra> is displayed in the secondary box, for example “{fullData.name}”. To hide the secondary box completely, use an empty tag <extra></extra>.i checked this for the type=box but aading tag in the last it wont work may be because of i am using the hovertext not hovertemplate. it wont work for the hovertext.
Please suggest for the type box and showing hovertext as mean median and that extra information
Hi ,
Thanks for the above solution.
But this solution works when we have hoveronBox =true which means when we box data but in case of single point it will not work i added tag in hoverText but it won’t work.i think this tag works for hovertemplate.
Please suggest how to fix if i have single point in box and i have hovertext which shows on demand.
Thank you.
I want to understand, do you only want the data that you have marked in yellow?
no that is extra information showing on hover in box plot that only i want to remove but i have above box and also some single point in same box graph .
if i hover on box it shows above information with extra yellow highlighted information. and if i hover on single point in the same graph it shows i added hover text information with yellow highlighted extra information.
Now you added above solution work for box which is hoverinfo :y+name but for single point i want to add my hovertext information without that extra information.