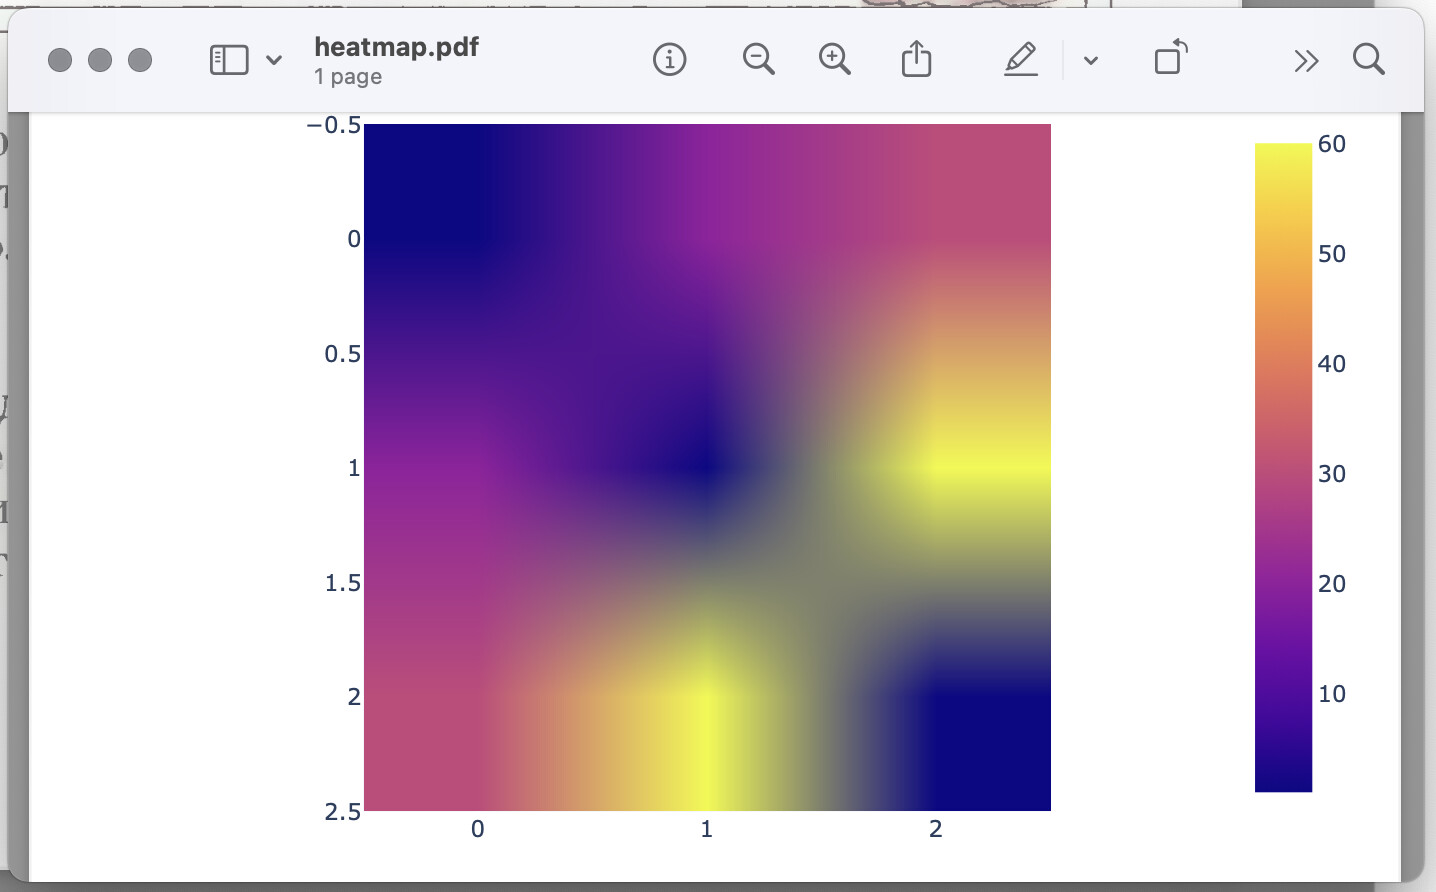
The solution there was to set interpolation='nearest' (as in ax1.imshow(data, interpolation='nearest')). Is there a similar way to set the interpolation in Plotly?
That’s the same result I got, @ducky . Thanks for sharing.
A quick workaround might be to save the image as a .svg file.
import plotly.express as px

data = [[1, 20, 30],
[20, 1, 60],
[30, 60, 1]]
fig = px.imshow(data)
fig.write_image("heatmap-svg-type.svg")
But I realize it’s only a workaround.
@liamc any idea for how this can be done in pdf?
I don’t think there is a direct interpolation='nearest' equivalent in Plotly Express. It looks more like a preview rendering behavior, rather than a bug.
Comparing with matplotlib, I see that they encode the full size image of the heatmap into an svg, while plotly has 2x2 image. Maybe this is the reason? The code to compare:
import matplotlib.pyplot as plt
import plotly.express as px

if __name__ == "__main__":
    data = [[1, 2],
            [2, 1]]
    plt.imshow(data)
    plt.axis('off')
    plt.savefig("heatmap.plt.svg")

    fig = px.imshow(data)
    fig.update_layout(xaxis_visible=False, yaxis_visible=False)
    fig.update_traces(dict(showscale=False, coloraxis=None), selector={'type': 'heatmap'})
    fig.write_image("heatmap.px.svg")