Hi,
I have a bar chart with two traces, let’s say food consumption and height per animal (for this example) - code to produce it at the end of the post.
In this example, the chart is sorted (not automatically just manually by how the list inputs are actually ordered) by the data in the first trace, trace1, i.e., food consumption in this example. Elephant first as it consumes more, then panda, then camel.

However, the second trace, trace2, height, is not sorted, which is fine when one is showing both traces at the same time. However, when I double click on it, to only see the trace2 (i.e., height) we see this:
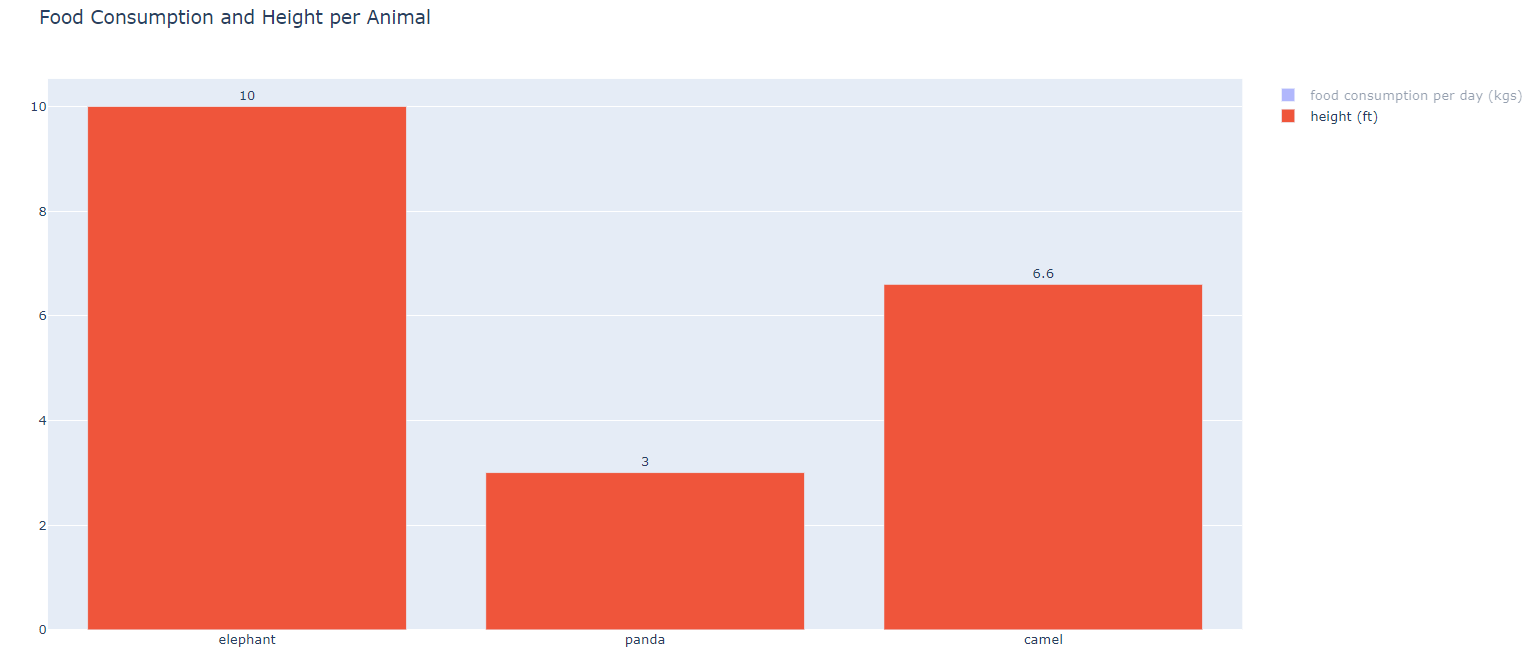
As we can see when I double click on height (ft) the data is not sorted by it’s y-value (i.e., height), if it were it’d show first elephant, then Camel and then Panda. but it’s showing panda then camel. Is it possible for it to automatically sort it by it’s y-value when one double clicks on a different trace?
import plotly
import plotly.graph_objects as go

trace1 = go.Bar(
    x=['elephant', 'panda','camel'],
    y=[181, 24, 15],
    text=[181, 24, 15],
    textposition='outside',
    name='food consumption per day (kgs)'
)

trace2 = go.Bar(
    x=['elephant', 'panda','camel'],
    y=[10, 3, 6.6],
    text=[10, 3, 6.6],
    textposition='outside',
    name='height (ft)'
)

layout = go.Layout(title='Food Consumption and Height per Animal')
fig = dict(data=[trace1, trace2], layout=layout)