Hi there,
I’m trying to colorize the bars in a barchart. There are 5 labels and 12 months.
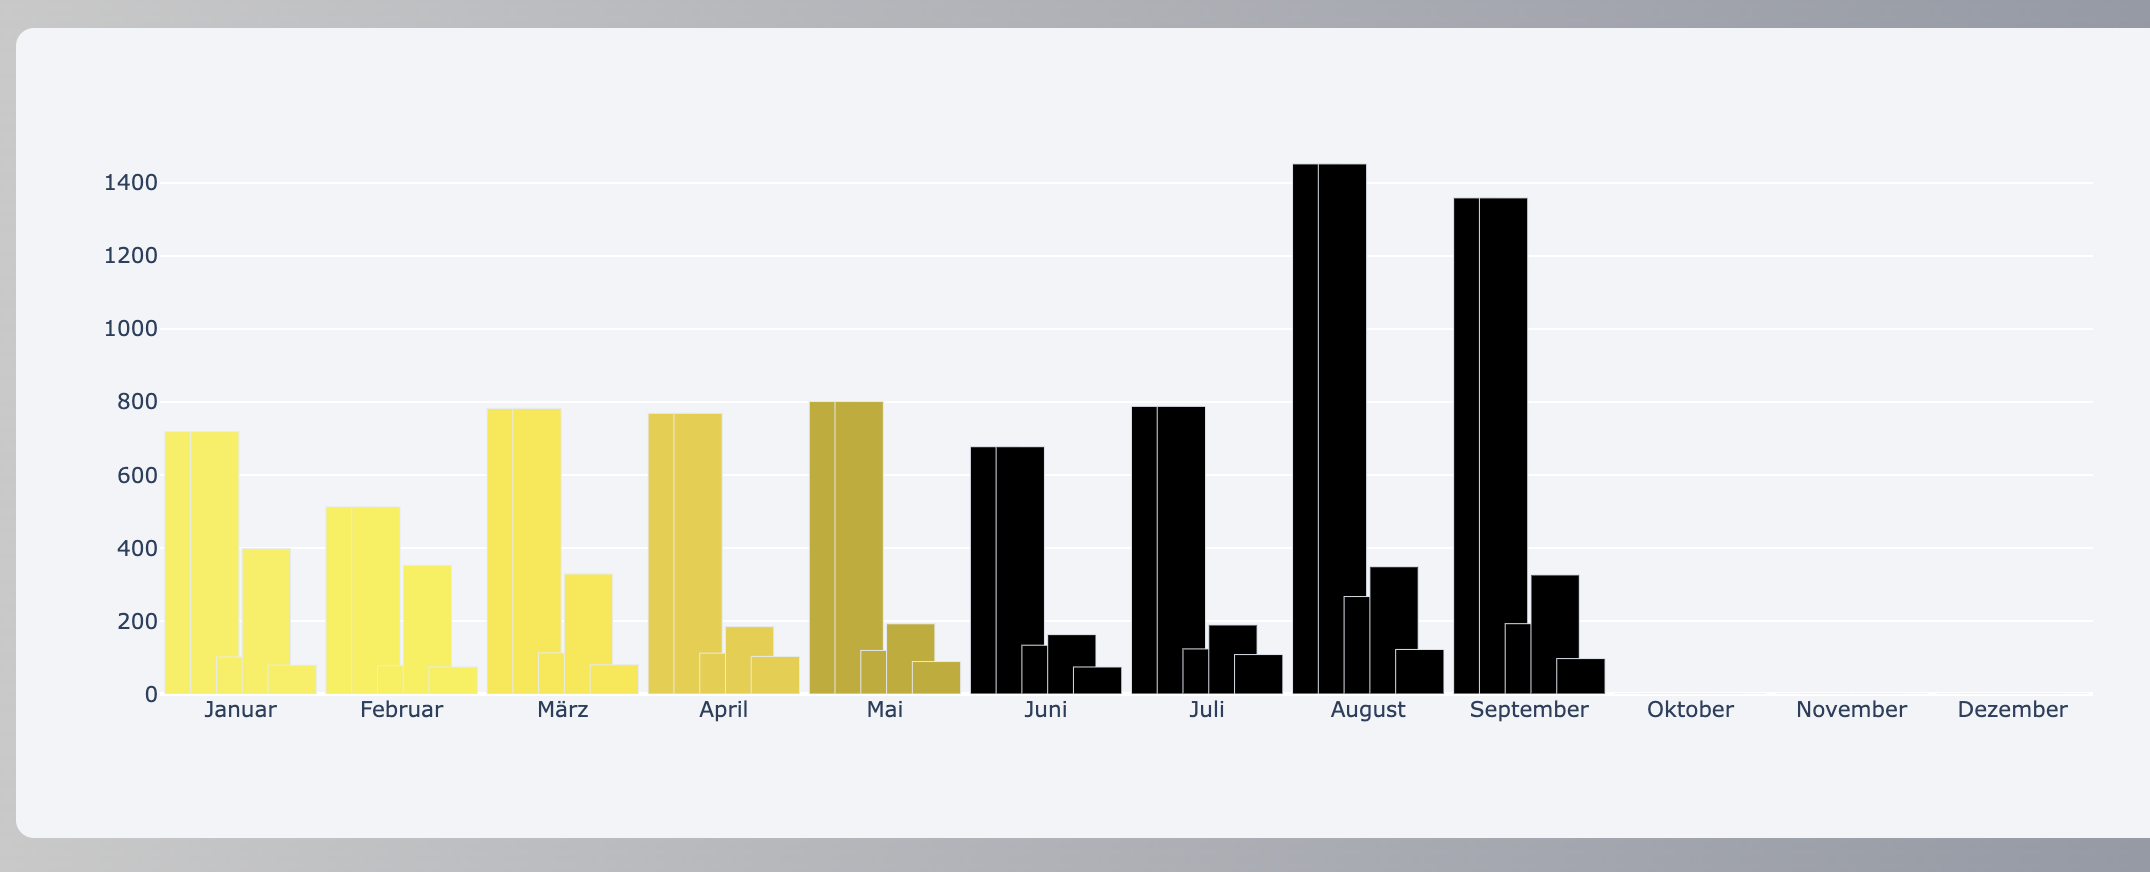
I want each month colored in this yellow shades, but unfortunately the script doesn’t respect the 5 label and colors each month instead of each bar.
marker = ['rgb(247, 241, 76)', 'rgb(247, 241, 65)', 'rgb(247, 233, 50)', 'rgb(232, 207, 50)','rgb(192, 173, 24)']

fig = px.bar(df_monthly, x=df_monthly.Monat, y=df_monthly_array, labels={"value": "", "variable": "", "Monat": ""}, barmode="group")
fig.update_layout({ 'paper_bgcolor':'rgba(242,244,247,1)',  'plot_bgcolor':'rgba(0,0,0,0)'})
fig.update_traces(width=0.3, marker_color=marker)
What do I have to change ?
Thank you!
If you would be willing to change from express to graph_objects, this is how I would do:
import plotly.graph_objects as go

marker = ['rgb(247, 241, 76)', 'rgb(247, 241, 65)', 'rgb(247, 233, 50)', 'rgb(232, 207, 50)','rgb(192, 173, 24)']

fig = go.Figure()

cols_excluding_month = [col for col in df.columns if col != "Month"]

for idx, col in enumerate(cols_excluding_month):
    fig.add_trace(
        go.Bar(name=col, x=df_monthly["Month"], y=df_monthly[col], marker=dict(color=marker[idx]))
    )

fig.update_layout(barmode="group")
Not sure how to make it work for a group in express that is not defined by values in a column.
Another option would be to use your approach with express, but update the traces individualy:
for idx, trace in enumerate(fig["data"]):
    trace["marker"]["color"] = marker[idx]
awesome! Thank you jlfsjunior. It works perfectly