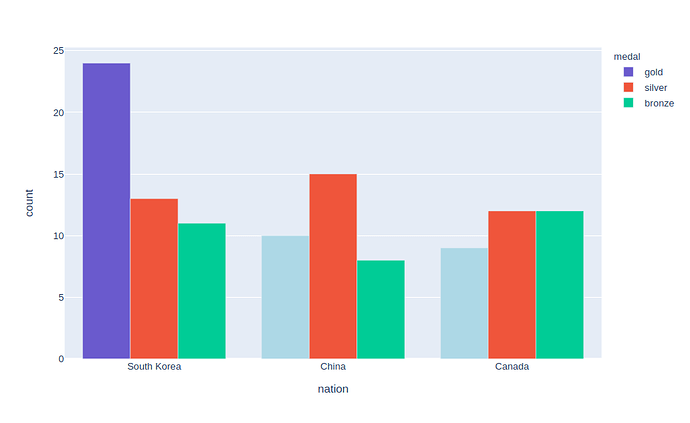
For a project I am working on I am looking for a way to have the color of individual bars dependent on multiple variables within my data frame (string and boolean). More specifically I want certain bars within my stacked bar graph to be presented with a different color if the Partial Period boolean is true while maintaining different colors for the string values
fig = px.bar(
                        title='{}: {} vs Time'.format(dropdown_value, radio_choice) if dropdown_value else
                        '{}: {} vs Time'.format(list_of_names[-1], radio_choice),
                        data_frame=filtered_df,
                        x='Date of Event',
                        y='Measure Value',
                        color='Variable Name',
                        barmode='group',
                        hover_data=['Partial Period']
I’ve been looking for a way to do this without any luck, and would greatly appreciate it if anyone knows a solution
Thank you

