Is it possible to have bars with x coordinates based on time ranges? I am thinking to use column width but not sure how to position a column’s left edge at a specific x value.
Thanks
Is it possible to have bars with x coordinates based on time ranges? I am thinking to use column width but not sure how to position a column’s left edge at a specific x value.
Thanks
Hi @Zolotoy could please explain in more details what you would like to do (maybe including a schematic drawing)? I don’t understand.
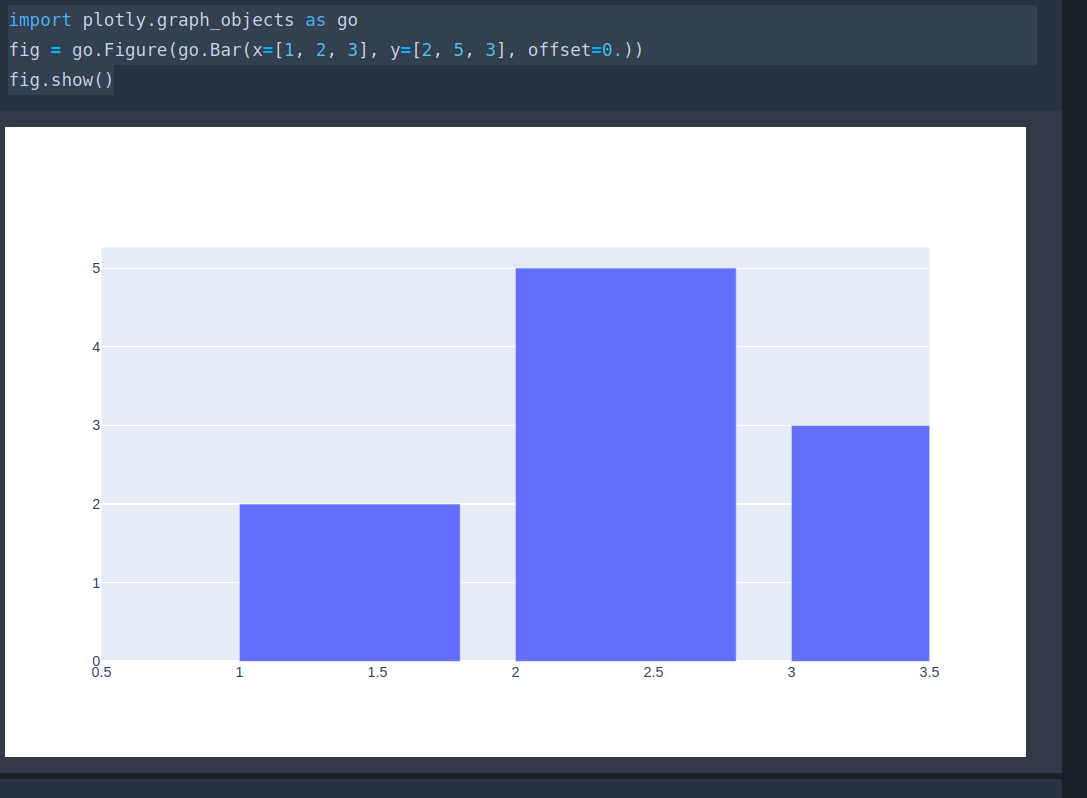
You can use the offset parameter of a bar trace for this. Below is an example with Python code, but it translates directly in Javacript
Ah, I see thanks. Not very relevant: How can I remove a border from a bar? Is it applied by default?
You can configure bar markers as described in https://plot.ly/javascript/reference/#bar-marker
The reason I am asking is this:
On this screen you should a wide area in reed color:

but when I zoom in I dont see that wide area:

What’s a value for offset supposed to be?