Hi, for my bar chart to be in percentage I used barnorm = ‘percent’. My challenge is when hovering to present the y data in % and also in number (the y is number and the barnorm is doing the transformation to %).
Currently, when hovering it’s showing both, but I want to add some text before and format and when I’m using hovertemplate on y it’s only showing the y in percentage.
code:
y_low = [0, 1]
y_moderate = [119, 570]
y_high = [0, 2]
y_very_high = [0, 0]
Plotting the data on stacked bar chart in %
x = [‘Default Policy’,‘Custom Policy’]
trace1 = go.Bar(
x=x,
y=y_low,
name = ‘Low’,
hovertext=y_low
)
trace2 = go.Bar(
x=x,
y=y_moderate,
name=‘Moderate (Default)’,
hovertext=y_moderate
)
trace3 = go.Bar(
x=x,
y=y_high,
name=‘High’,
hovertext=y_high
)
trace4 = go.Bar(
x=x,
y=y_very_high,
name=‘Very High’,
hovertext=y_very_high
)
data = [trace1, trace2, trace3, trace4]
layout = go.Layout(
title=‘Title aaa’,
barmode=‘stack’,
barnorm = ‘percent’,
yaxis=dict(title = ‘%’, hoverformat=‘.1f’),
)
fig = go.Figure(data=data, layout=layout)
fig.show()
Here is the chart result and example of the wanted output:
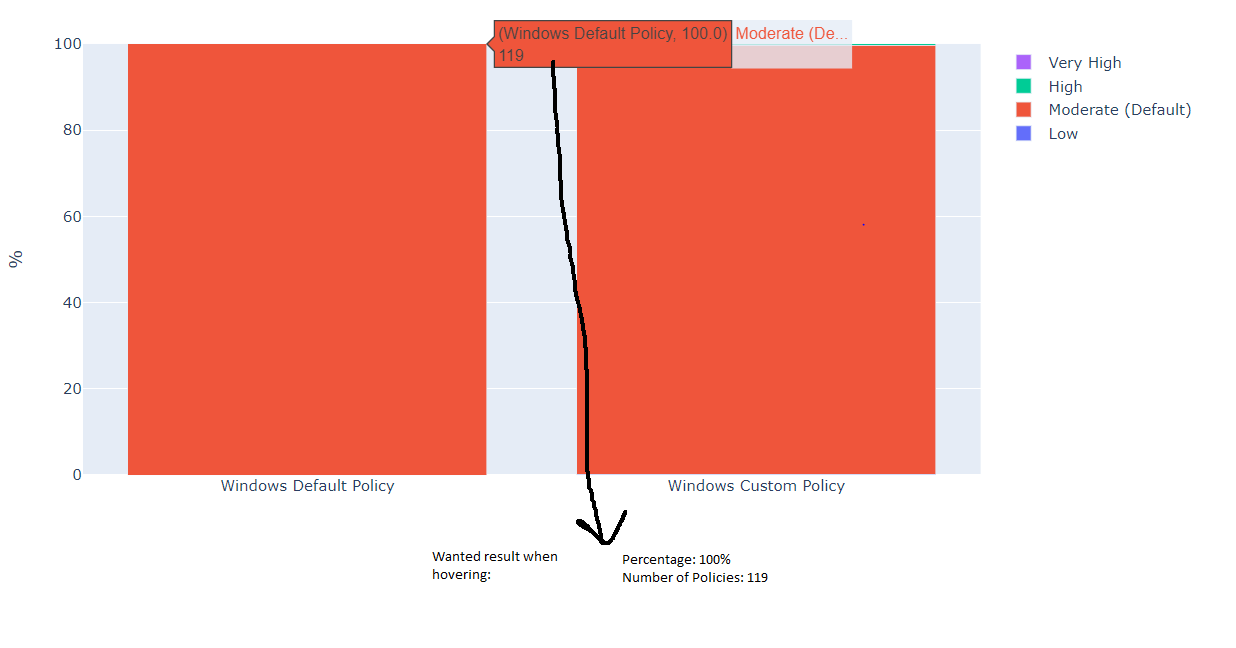
Thanks!